How to Interpret PageSpeed Insights Correctly: Why a Score of 69 Doesn't Mean Much and Which Metric Really Matters
The handwerk.de website scored 69 points on PageSpeed Insights, even though real visitors see the largest element after 1.4 seconds. Based on our own measurements, we’ll show you which part of the report you should read, how to deal with “No data,” and which three areas you can tackle on your own.
Date
Category
Author

“Google gives our website a score of 69. Is that good or bad?” This is the kind of question we get regularly, usually accompanied by a screenshot from PageSpeed Insights showing a prominent orange circle. The honest answer is: The number in the circle actually tells us surprisingly little. The part of the report that really matters is on the same page, just a little further up.
On September 29, 2026, we ran two websites through PageSpeed Insights on mobile: our own homepage and, for comparison, handwerk.de. Both scored exactly 69 points. Yes, even us: A web agency that builds fast websites for others ends up with its own homepage in the orange zone. It’s kind of like a driving instructor scraping the curb while parallel parking. There’s no point in hiding it, so in this post, we’ll take our own site apart in front of everyone.
On handwerk.de, real visitors experience a fast-loading site despite the 69; no one can say that about us, and our report features a construction site where you can clearly see how to read it.
This post assumes that you’ve already entered your address there, and walks you through the report in the order you’ll need it: measure, read the top section, check the bottom section, take action. All information about the tool comes from Google’s own documentation on PageSpeed Insights, Lighthouse, and the Core Web Vitals, accessed on September 29, 2026. Where the German help text is incorrectly translated, we’ve used the English version and noted it accordingly.
In a nutshell (as of September 2026)
In PageSpeed Insights, start by reading the top section titled “Here’s how performance looks from the user’s perspective”—not the score. That’s the only place where you’ll find data from real visitors over the last 28 days, and it’s the only way to determine whether you’ve met the Core Web Vitals standards. The score comes from a single simulated test run on a slowed-down cell phone: For handwerk.de, the lab test showed 69 points and 7.4 seconds, while real visitors saw the largest element after 1.4 seconds. If “No data” appears at the top, use the lab value for Largest Contentful Paint, not the score.
Measuring Correctly: Mobile first, five runs, the middle value counts
On pagespeed.web.dev, always measure the “Mobile” view first, and never rely on a single test run. The interface automatically displays the mobile results first; the “Desktop” tab is right next to it. The mobile test is the more stringent one because it simulates a device with a slower connection. Be careful with tools that measure via the PageSpeed Insights interface: According to the documentation, the default setting there is “Desktop” unless you specify otherwise.
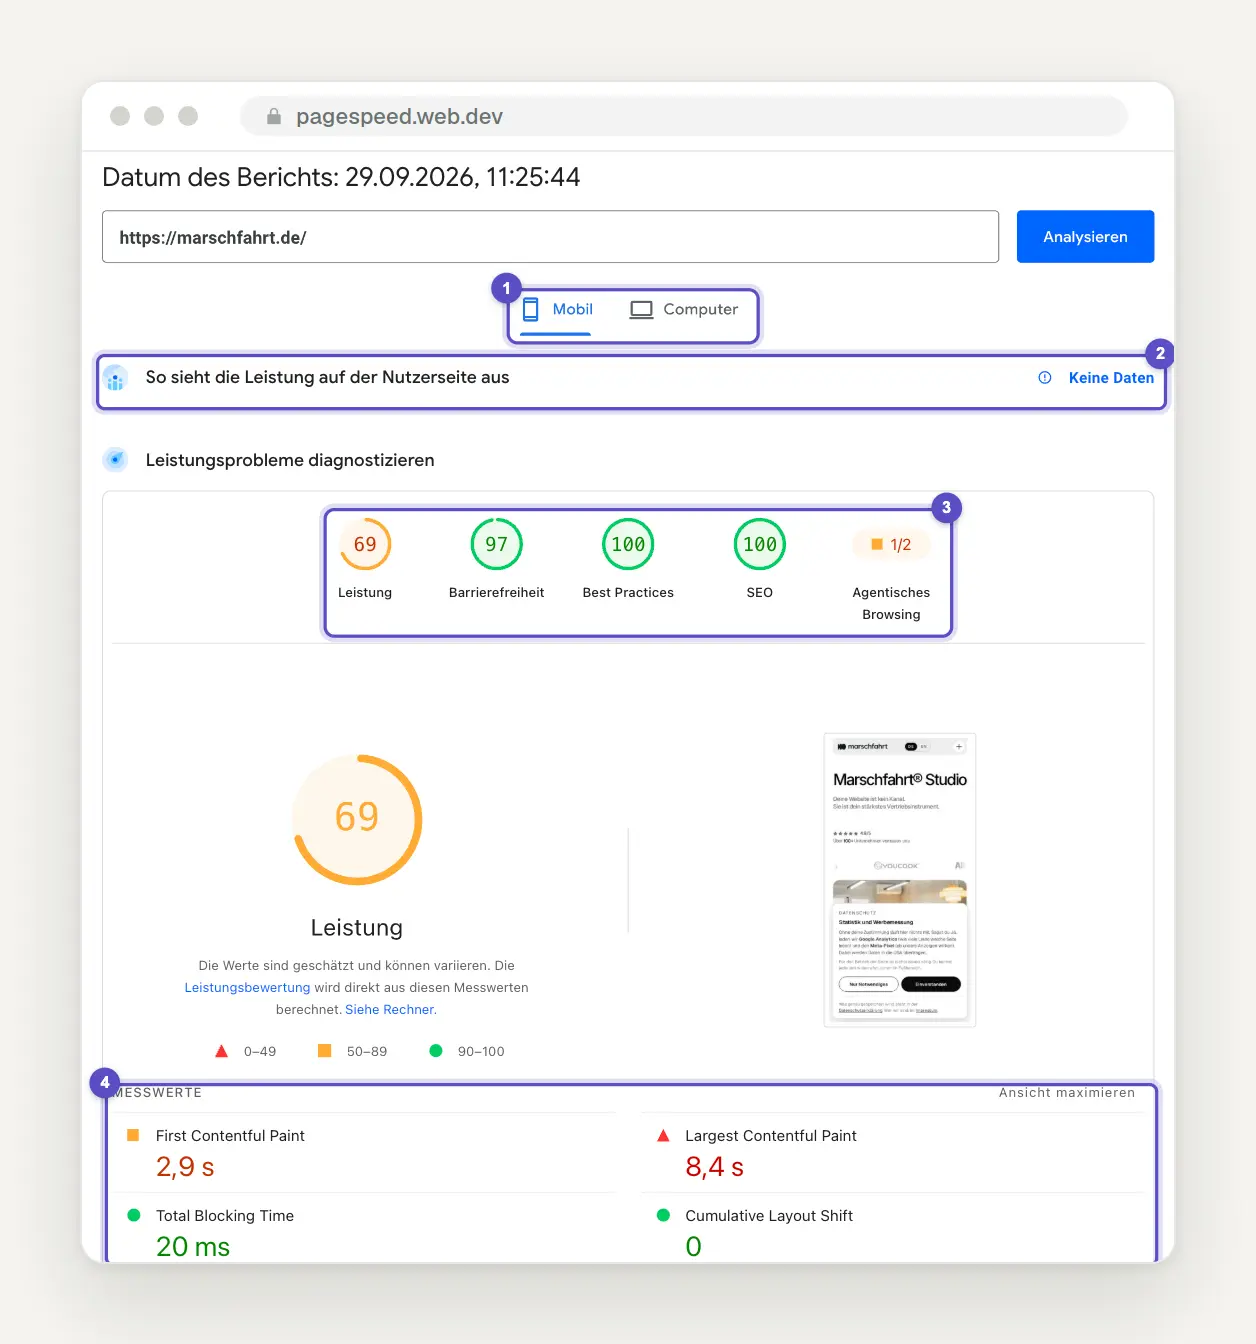
Our own homepage on September 29, 2026: at the top is the Mobile/Computer toggle (1), below that, the section for real visitors labeled “No Data” (2), the categories with performance scores of 69, 97, 100, 100, and Agent-Based Browsing 1/2 (3), and the lab metrics showing 8.4 seconds for Largest Contentful Paint (4).
In the lab, PageSpeed Insights simulates a mid-range smartphone. The report states: " Emulation of a Moto G Power with Lighthouse 13.5.0 and slow 4G throttling." According to Lighthouse documentation, this throttling results in 150 milliseconds of latency, 1.6 megabits per second for downloads, and 750 kilobits per second for uploads, and the processor is slowed down by a factor of four. Older guides still refer to this as “Fast 3G.”
Google itself advises against drawing conclusions based on a single run. The Lighthouse documentation recommends using metrics such as the median and states that the median of five runs is twice as stable as a single run. That’s why we do it this way: we measure five times, record the score and Largest Contentful Paint each time, sort the five values, and take the middle one.
For each measurement, add the date listed above under “Report Date” and save the report by clicking “Copy Link.” Don’t just measure the homepage—also measure the page that generates the most traffic for you, which is usually a service page. Create a small spreadsheet today with these two URLs.

Here's how we measure in the studio: Start with the cell phone, take five runs, calculate the average, and only then read and compare the results.
Real visitors at the top, a test run at the bottom: which section counts?
Make decisions based on the top section as soon as values appear there, and use the bottom section for troubleshooting. At the top, under “This is what performance looks like from the user’s perspective,” PageSpeed Insights displays data from the Chrome UX Report—that is, data from real Chrome users over the past 28 days. Below, under “Diagnose performance issues,” Lighthouse runs a single scan of the page in a simulated environment. If the two results conflict, Google recommends relying on the field data.
handwerk.de illustrates just how significant this discrepancy can be. At the top of the page on September 29, 2026 , the Core Web Vitals rating read : “Passed, ” with 1.4 seconds for Largest Contentful Paint, 112 milliseconds for Interaction to Next Paint, and a Cumulative Layout Shift of 0. Further down in the same report: Performance 69, Largest Contentful Paint 7.4 seconds. The same page on the same day, measured once by real people and once using a simulated smartphone.
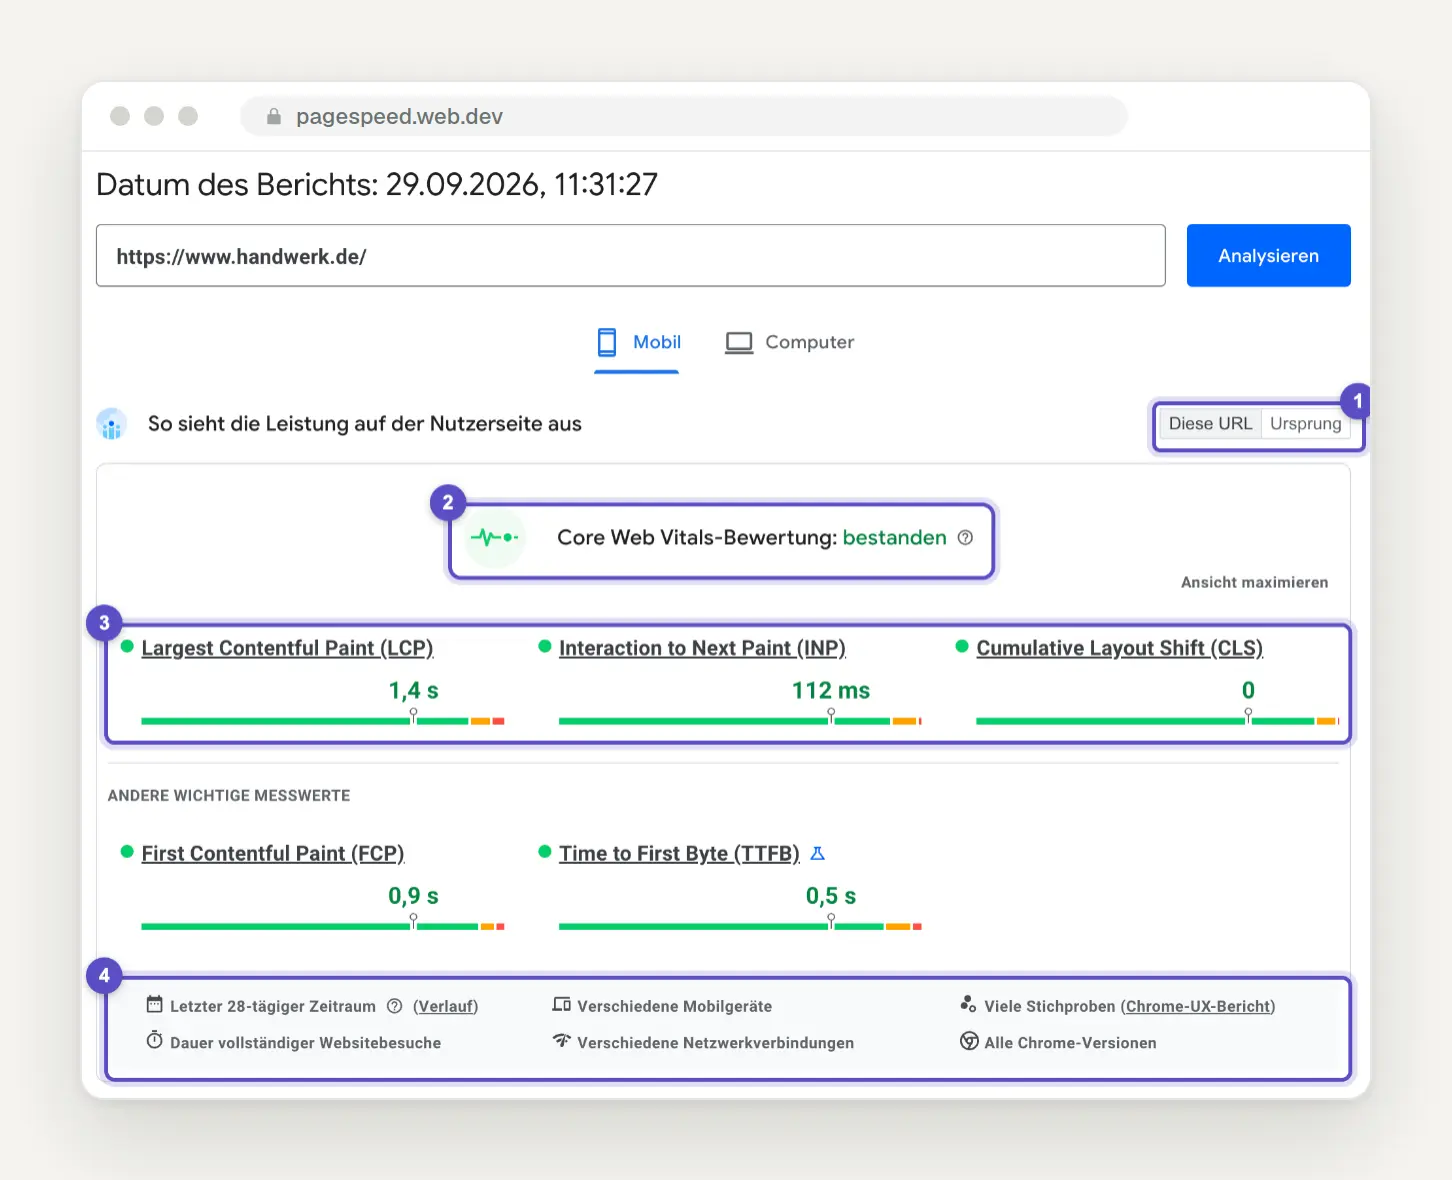
handwerk.de, top section: the toggle button This URL / source (1), the passed evaluation (2), the three Core Web Vitals with LCP 1.4 s, INP 112 ms, and CLS 0 (3), and the data for the 28-day period from the Chrome UX Report (4).
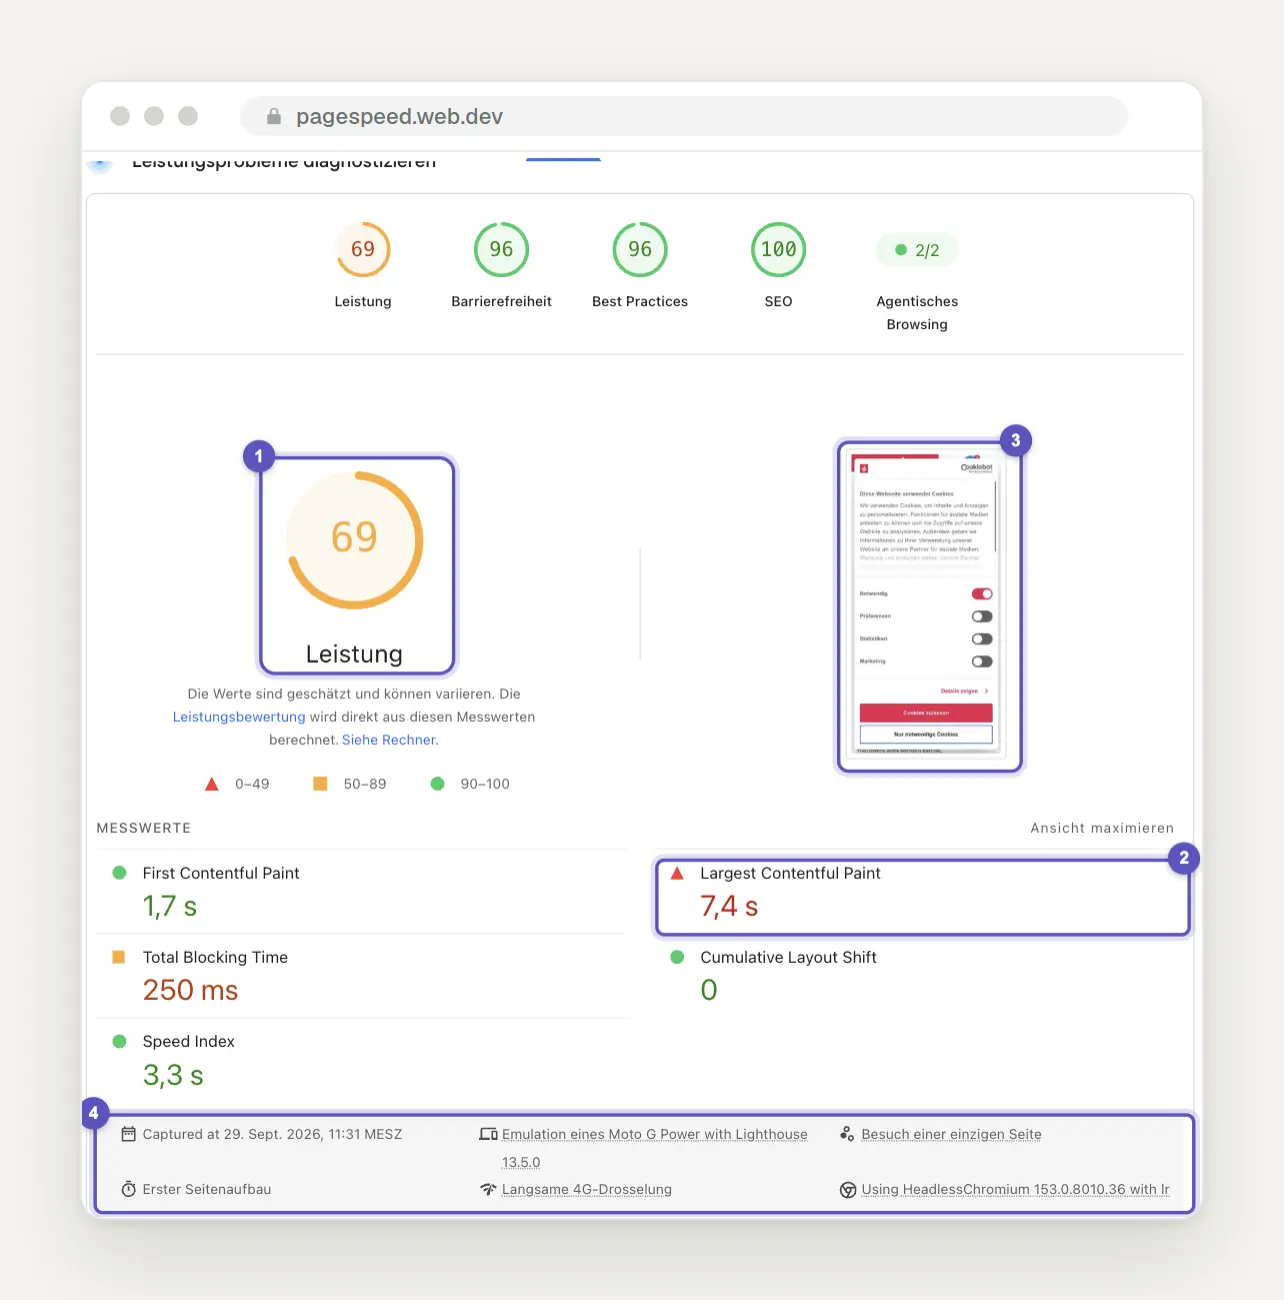
The same report below: Performance 69 (1) and a Largest Contentful Paint of 7.4 seconds (2). The preview shows a cookie banner at the top of the page (3); the test conditions (4) explain why the lab environment is so much slower than real visitors.
So the score doesn't reflect your visitors' experience. Google itself states that good lab results don't automatically mean good experiences for real users, and handwerk.de shows that the reverse is also true.
Two details at the top are worth noting. The toggle between “This URL” and “Site” switches between the individual page and the entire website, and if there isn’t enough data for the page, PageSpeed Insights automatically falls back to the entire website, according to Google. The value above the colored bar is the 75th percentile, meaning three-quarters of visits were at least that fast. On your site, start by looking at “This URL” and switch to “Origin” if nothing is displayed there.
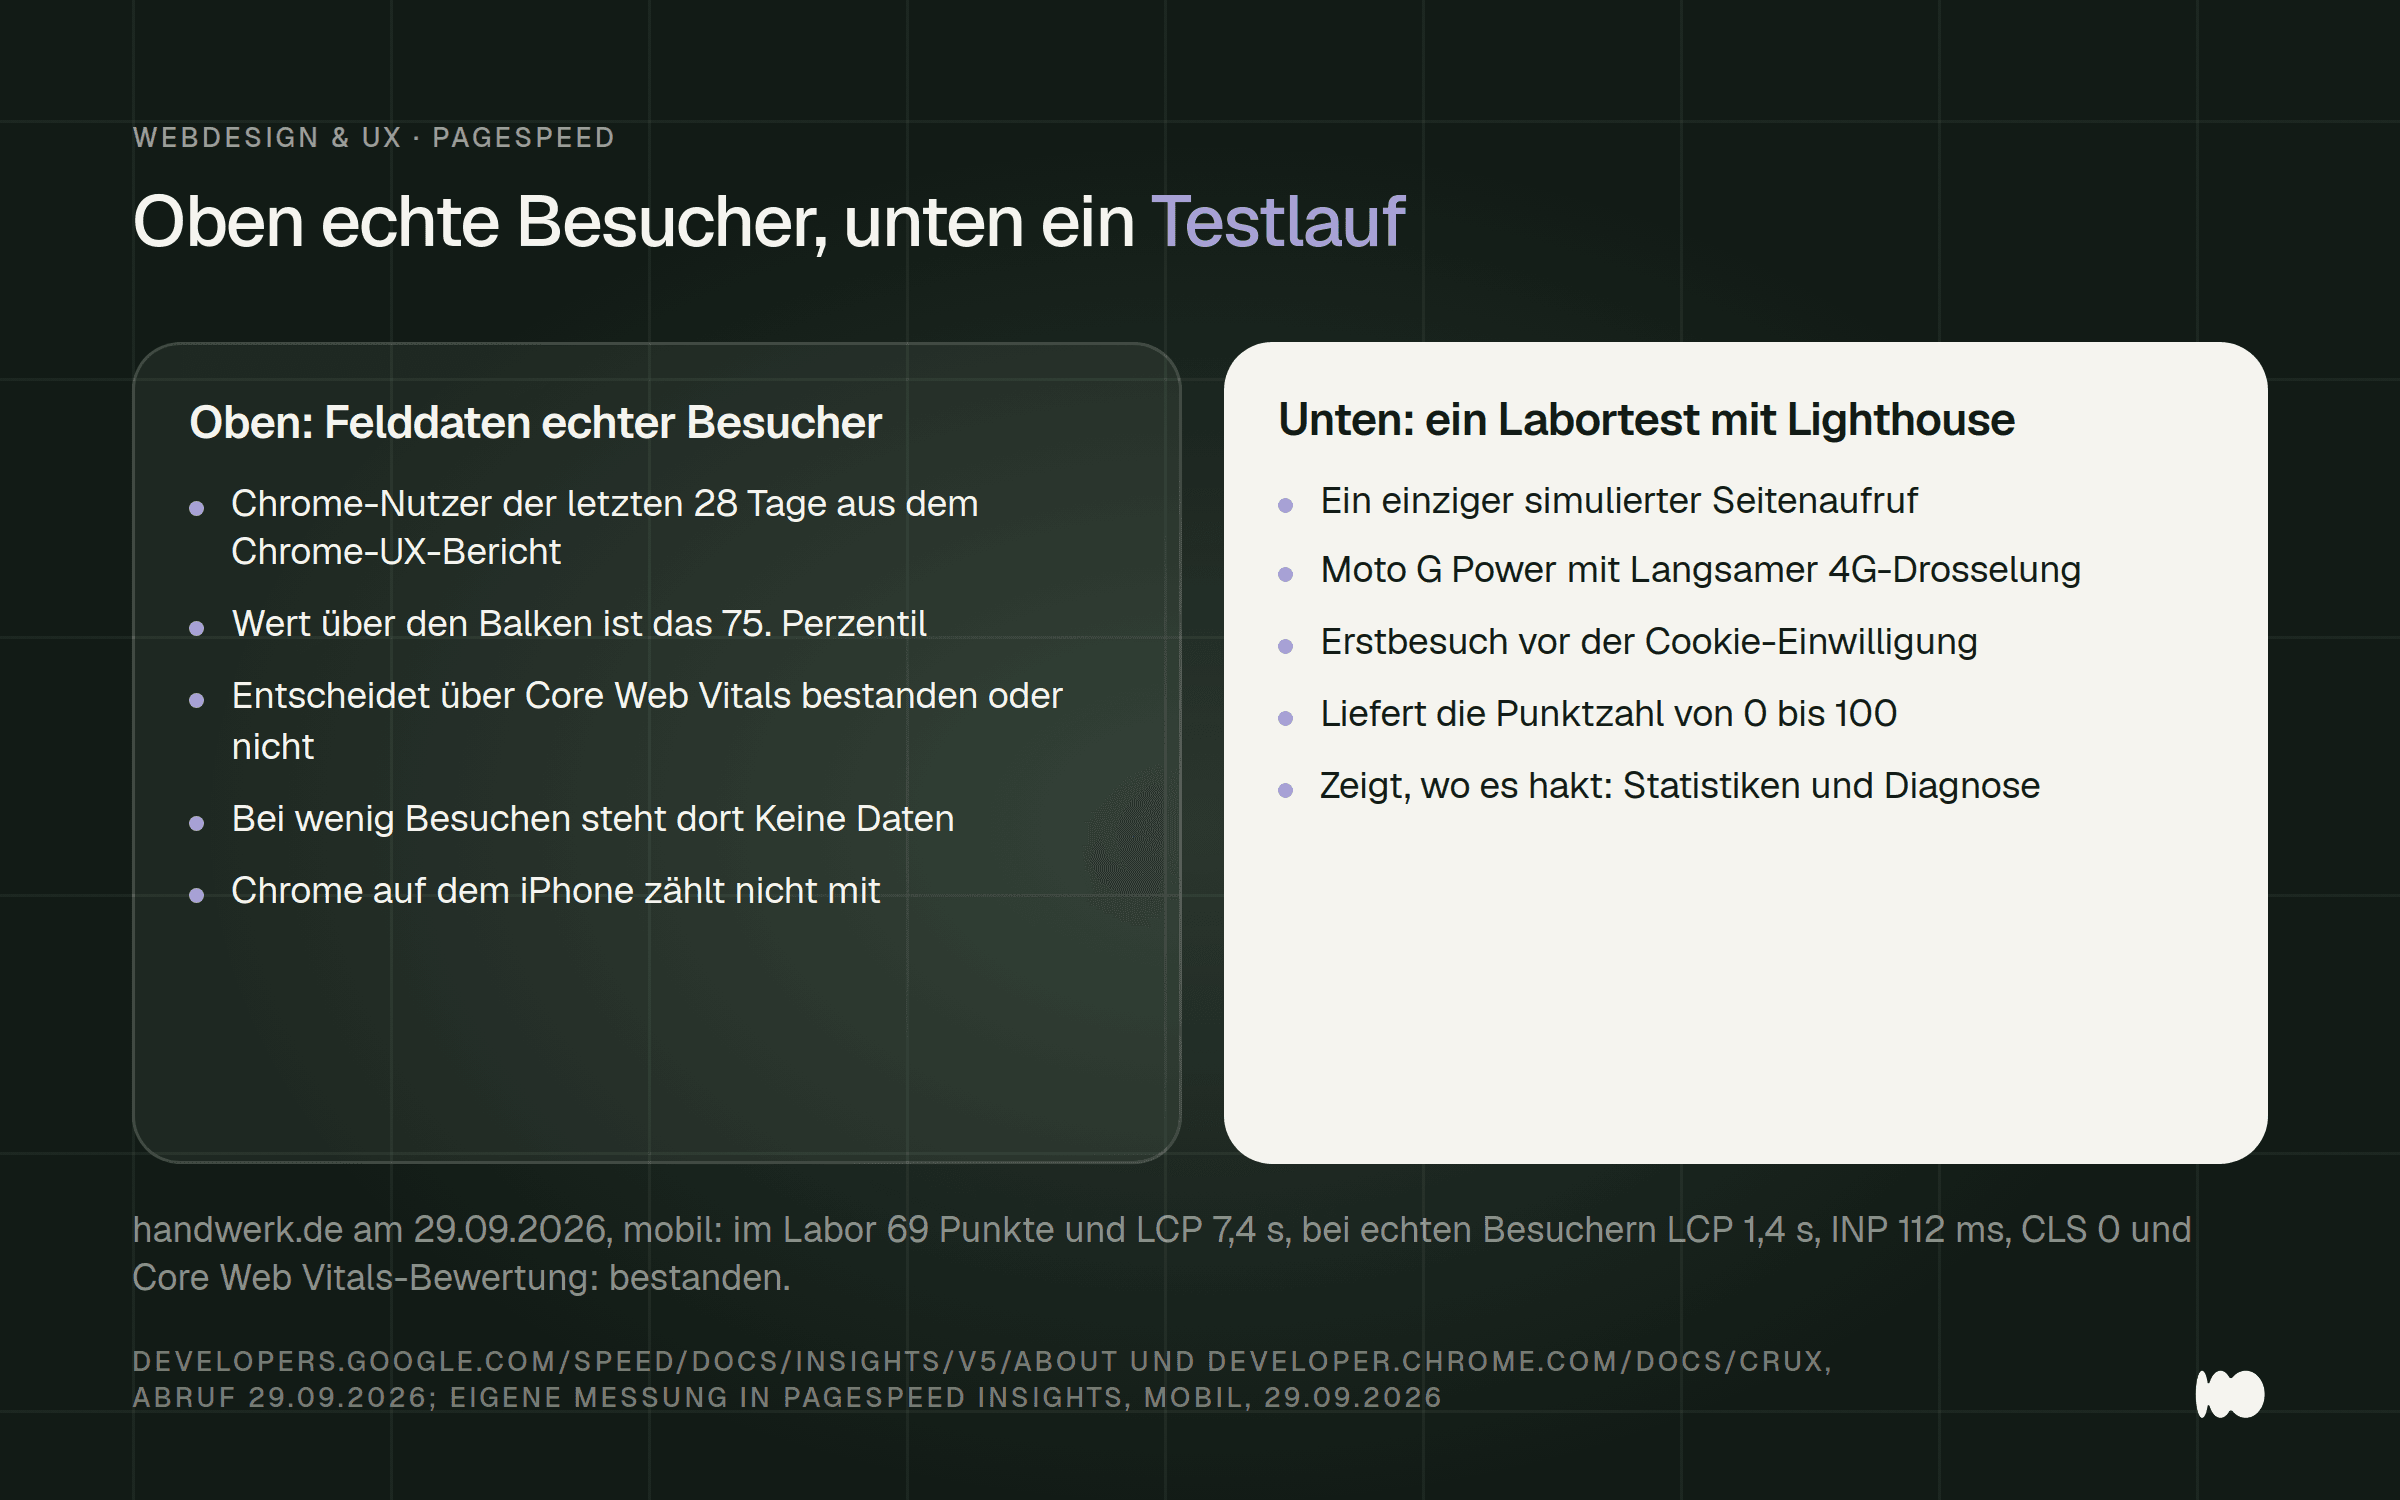
The two sections of a report side by side: actual visitors at the top, a single test run at the bottom, using the example of handwerk.de from September 29, 2026.
Three metrics you need to know: LCP, INP, and CLS
Keep three numbers in mind: 2.5 seconds, 200 milliseconds, and 0.1. These are the thresholds for a “good” score on the three Core Web Vitals, and the assessment is considered passed if all three fall below the 75th percentile. Largest Contentful Paint measures when the largest visible element appears, usually a cover image or a large headline. Interaction to Next Paint measures how quickly the page responds to taps and clicks, while Cumulative Layout Shift measures how much content shifts as the page loads.
Beyond that, the performance goes from needing improvement to poor: Largest Contentful Paint over 4 seconds, Interaction to Next Paint over 500 milliseconds, and Cumulative Layout Shift over 0.25. We’ve adopted these thresholds from the English documentation. In the German version, there are incorrect parentheses in two lines, and the same level is labeled once as “Improvement required” and once as “Optimization required.”
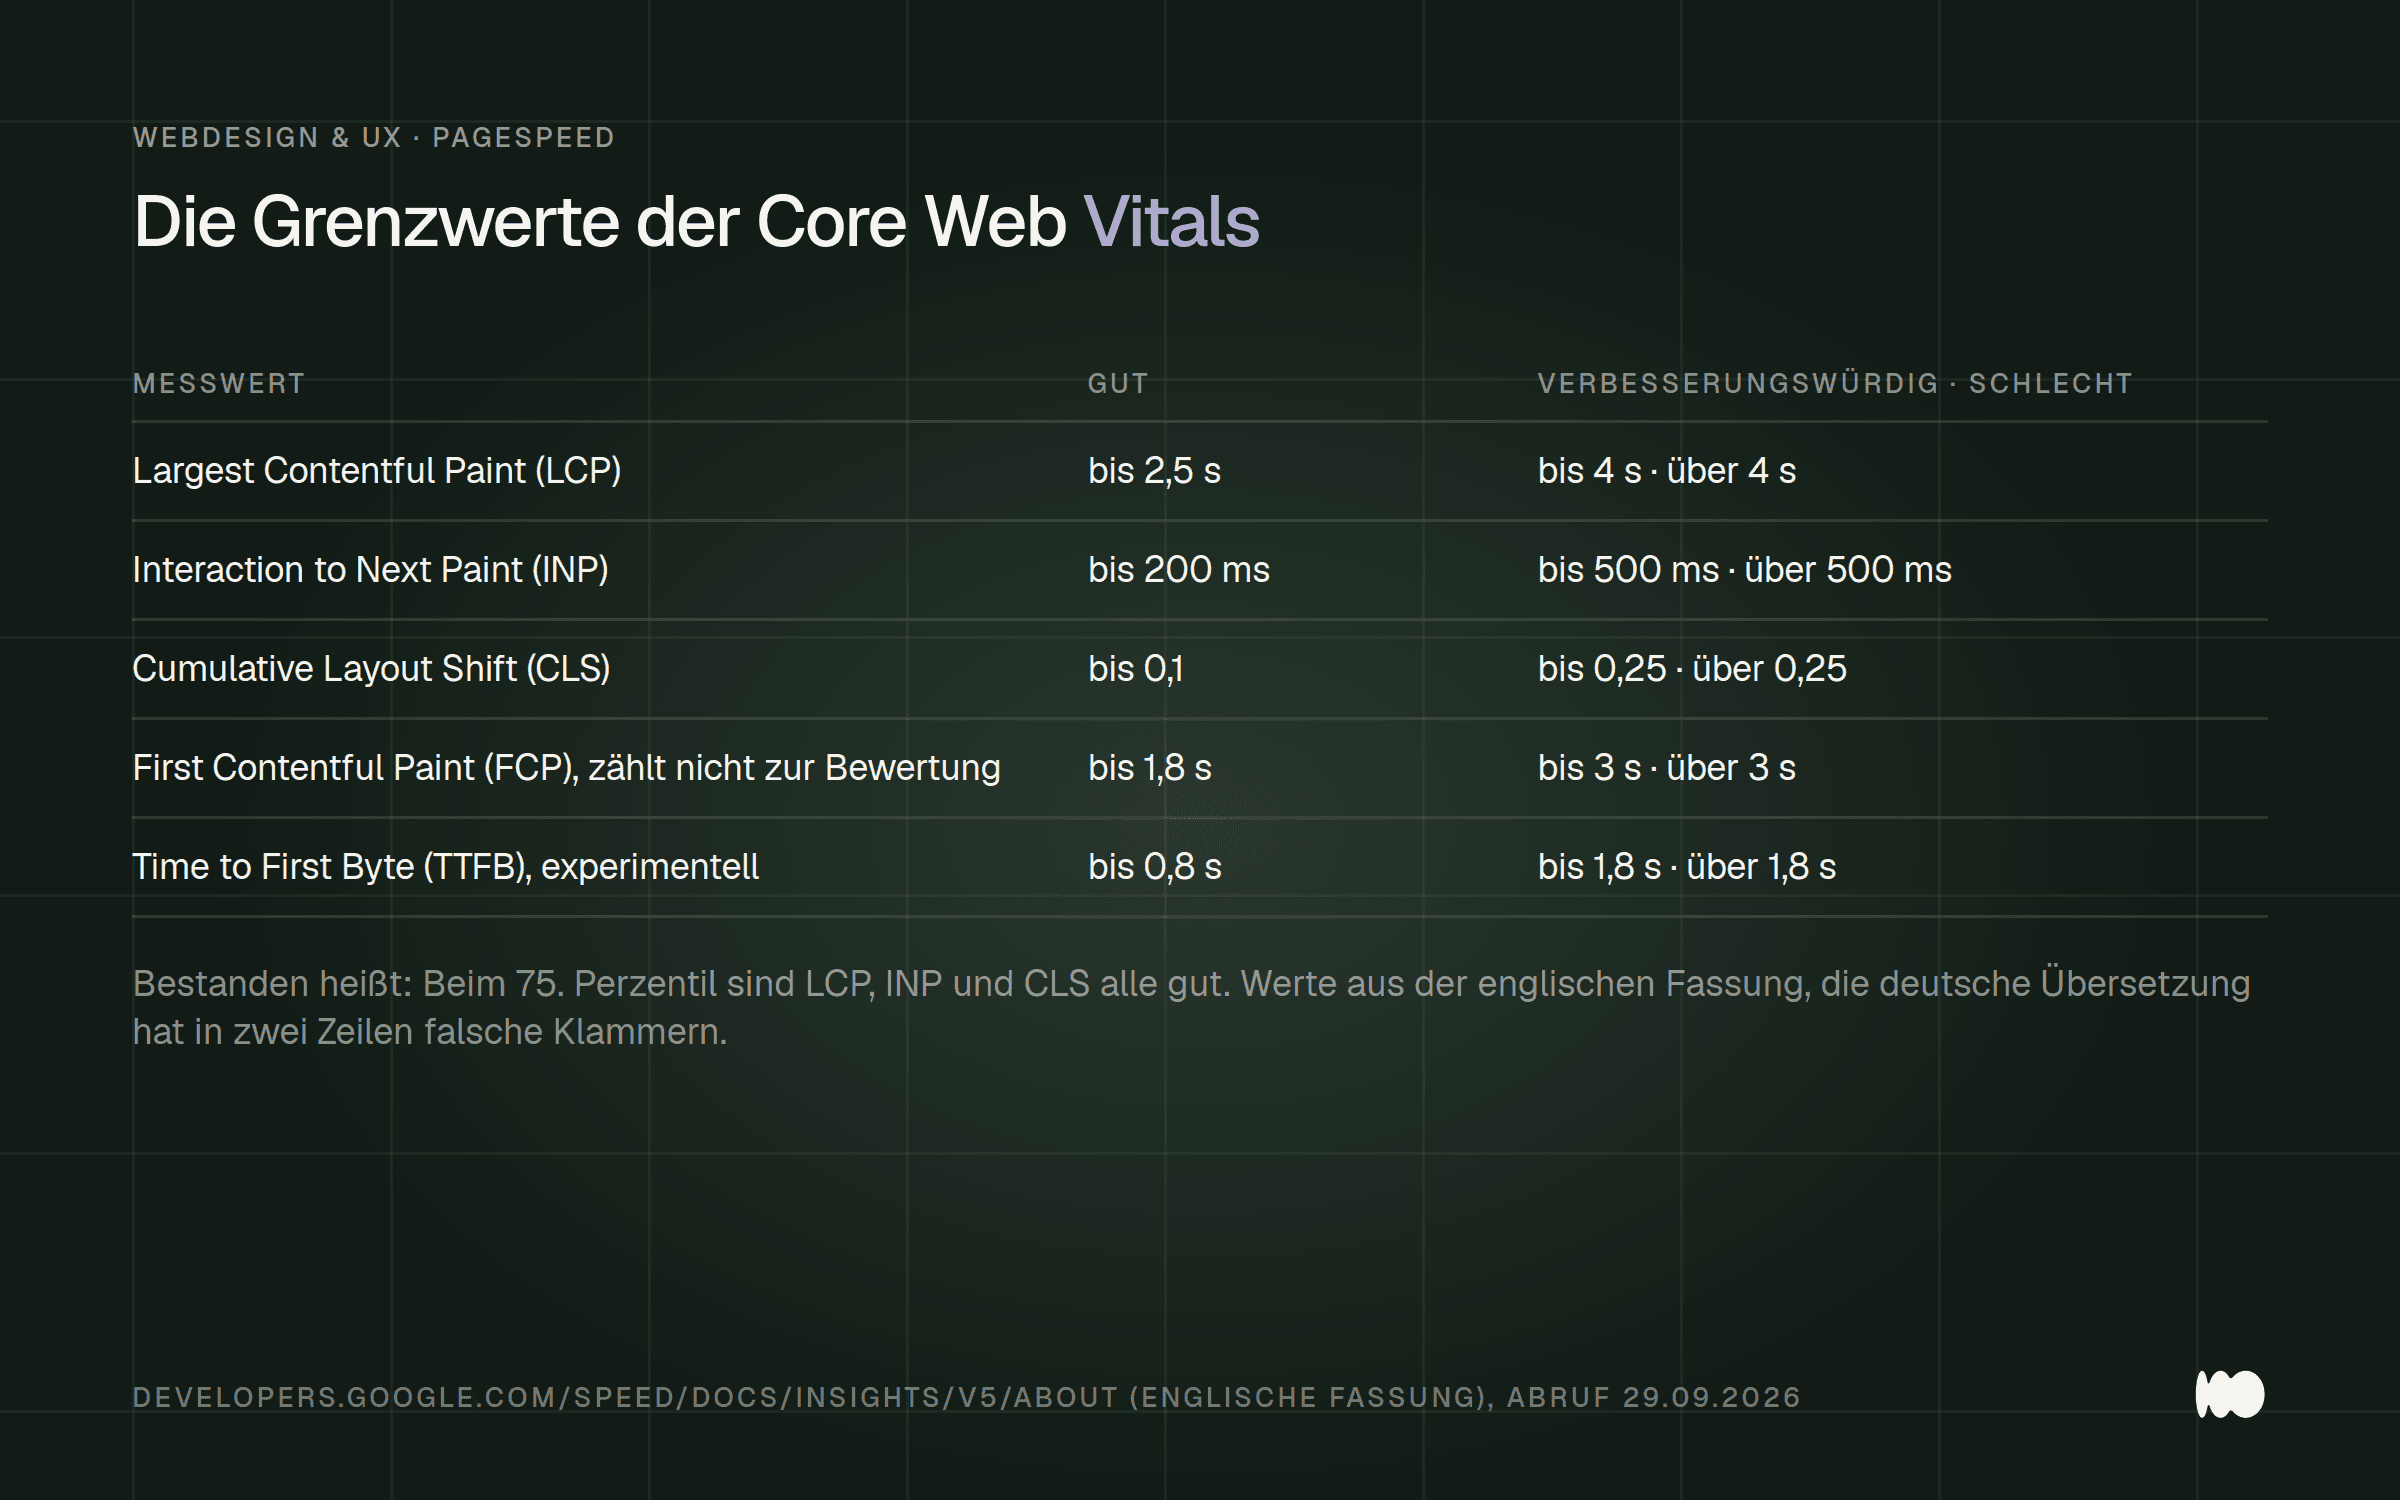
The thresholds from the English documentation for PageSpeed Insights. Only the first three lines determine whether the test is "passed."
First Contentful Paint and Time to First Byte are listed at the top under “OTHER IMPORTANT METRICS” and do not count toward the evaluation. If there isn’t enough data for Interaction to Next Paint, Google says that good LCP and CLS scores are sufficient to pass. First, check which of the three metrics on your page exceeds its threshold, because that’s exactly what determines the result.
Where the 69 comes from: Recalculating the score in five parts
Click “View Calculator” below the circle and see which metric costs you the most points. The performance score is based on five lab metrics: Total Blocking Time counts for 30 percent, Largest Contentful Paint and Cumulative Layout Shift each count for 25 percent, and First Contentful Paint and Speed Index each count for 10 percent. Google specifies these weights for Lighthouse 10, and they remained unchanged in our measurement using Lighthouse 13.5.0. Below the circle, it states: “The values are estimates and may vary. The performance score is calculated directly from these metrics.”
On our homepage, the 69 points are broken down as follows: Total Blocking Time, at 20 milliseconds, earns a full 30 points; Cumulative Layout Shift, at 0, earns a full 25. Speed Index, at 3.9 seconds, earns 8 out of 10; First Contentful Paint, at 2.9 seconds, earns 5 out of 10. Largest Contentful Paint, at 8.4 seconds, earns 1 out of 25 points; of the 31 missing points, 24 are attributable to it.
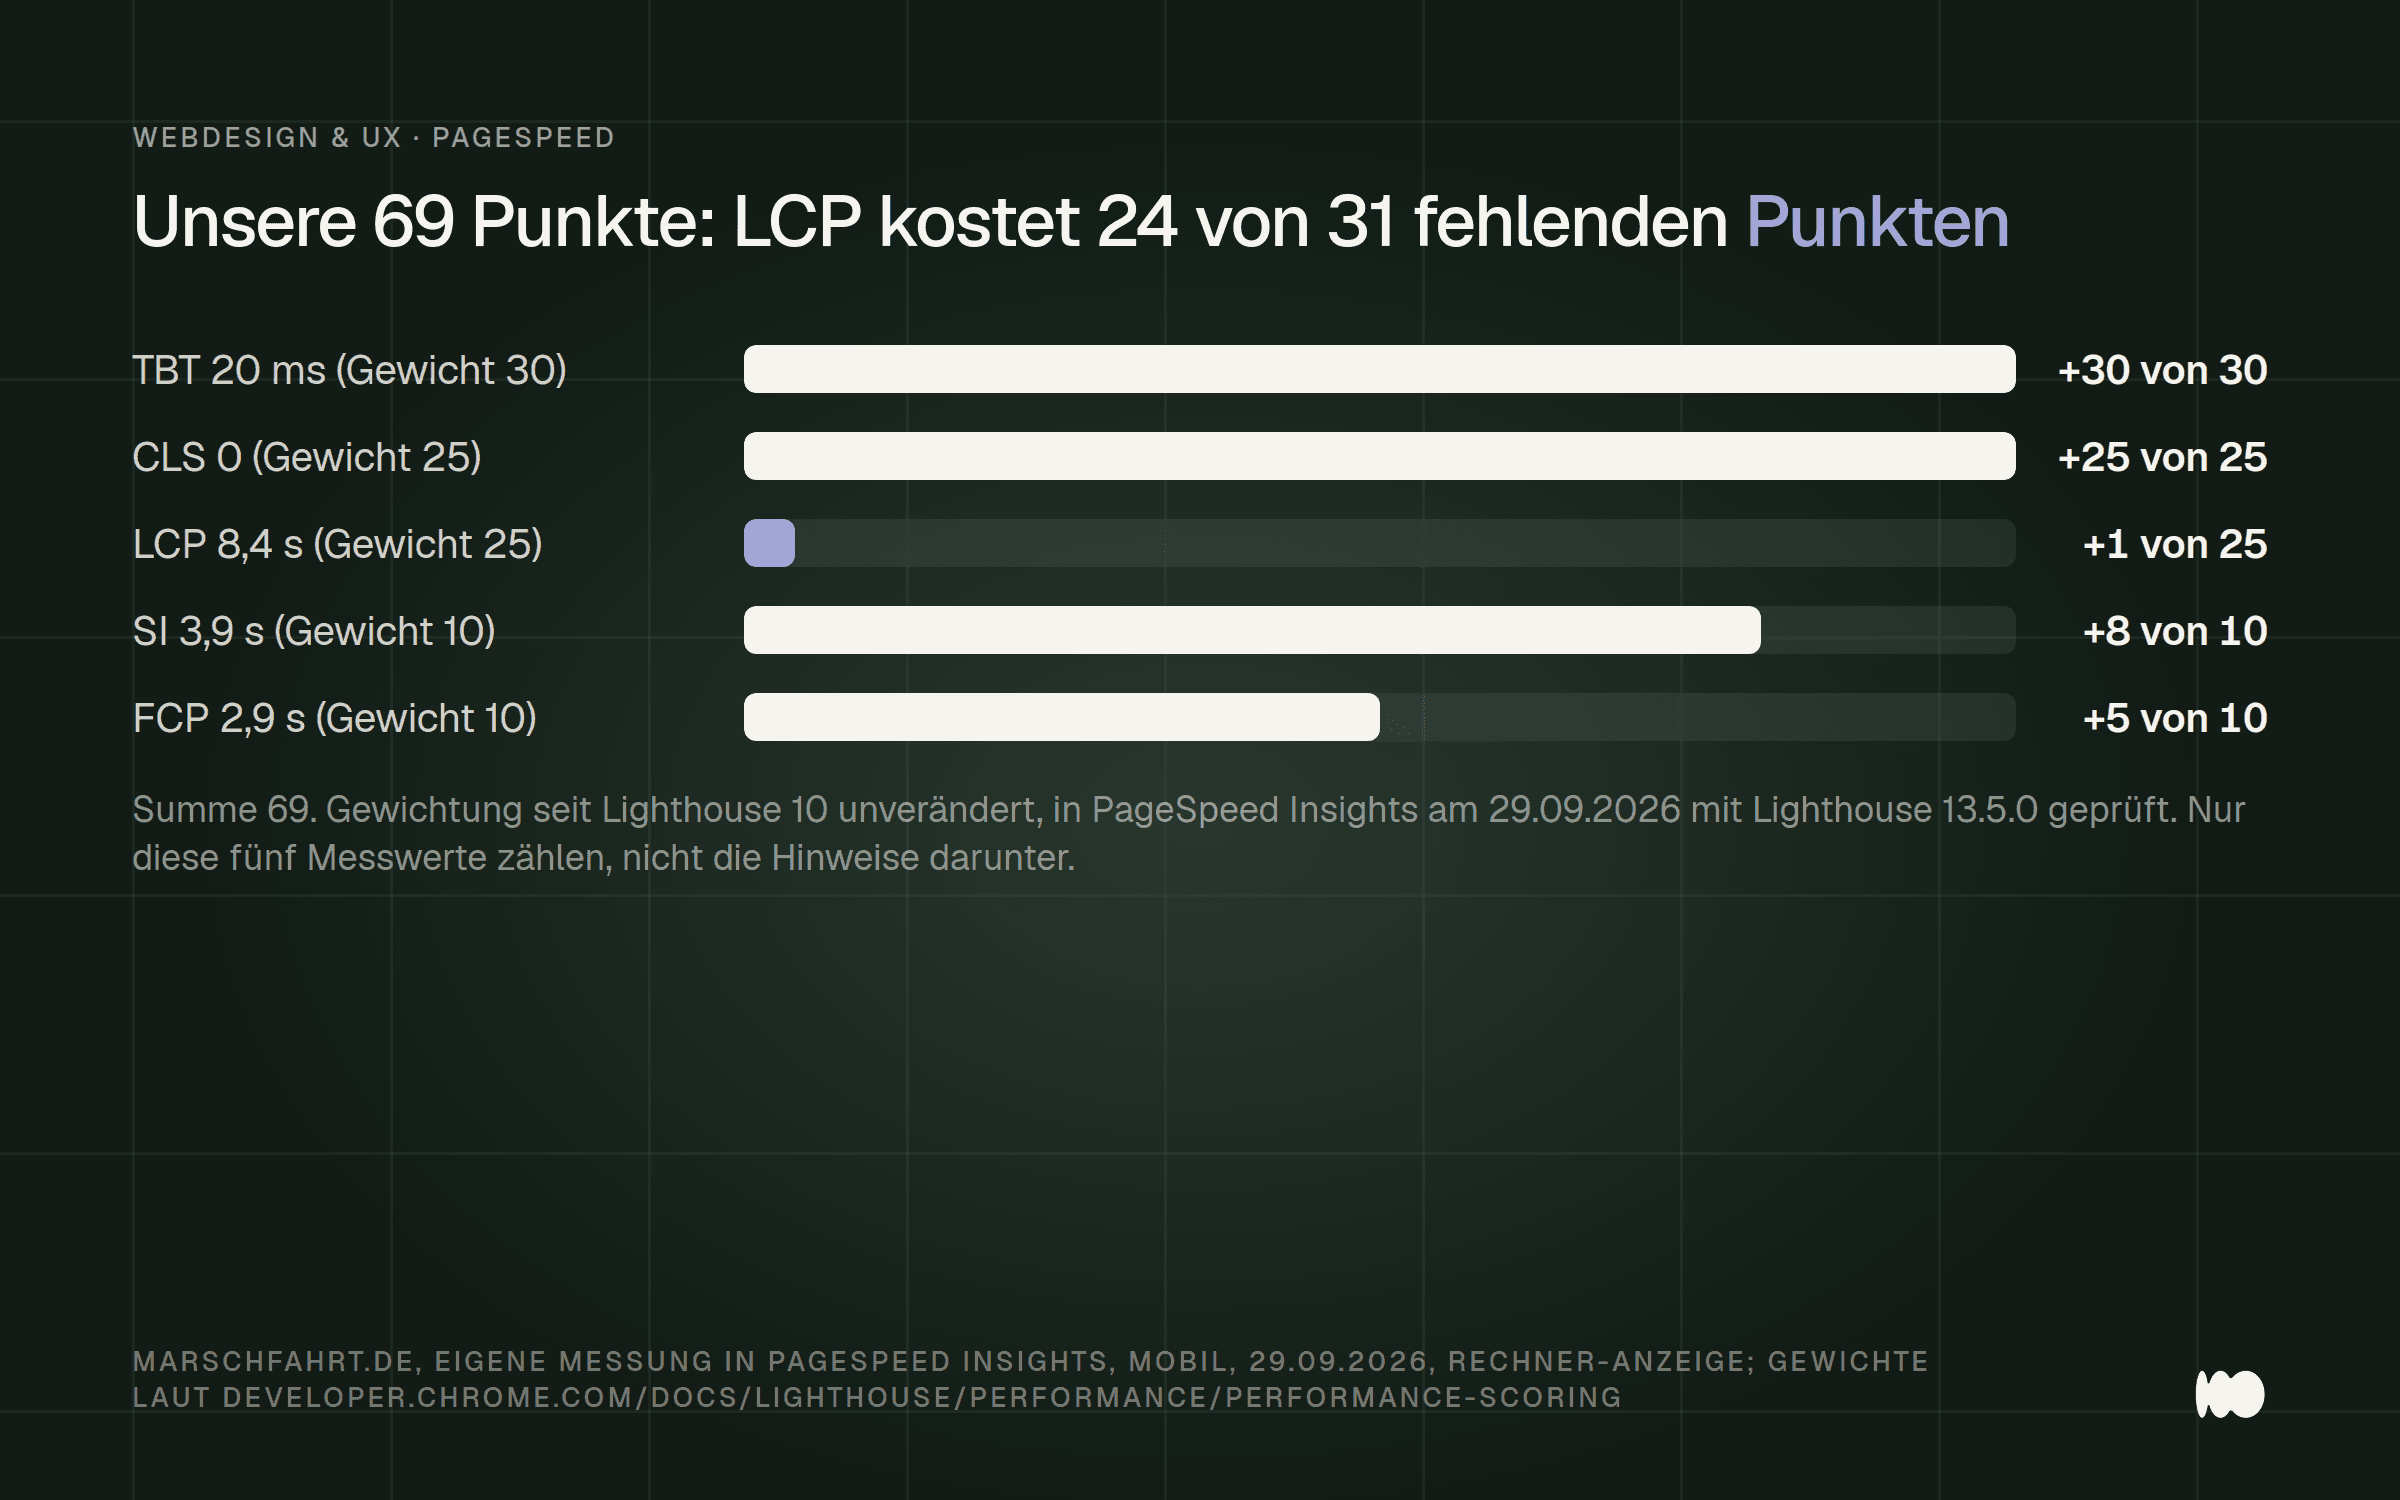
Our 69 points from September 29, 2026, broken down by the five metrics. A single metric—Largest Contentful Paint—accounts for almost the entire difference from 100.
Google has established how seconds are converted into points based on real websites. This is based on measurement data from the HTTP Archive: If a site’s performance is as fast as the 25th percentile of these websites, it receives 50 points; if it’s as fast as the 8th percentile, it receives 90. Mobile and desktop have their own performance curves, so a score of 69 on a mobile device means something different than a score of 69 on a computer.
Important for your priorities: Only these five metrics matter; the tips listed below don’t—according to Google, they only have an indirect effect through the metrics. And Google explicitly does not expect a score of 100; according to the documentation, going from 99 to 100 requires about as much improvement as going from 90 to 94. The green zone starts at 90. Identify the metric with the largest point loss and focus solely on that one first.
Why Your Score Fluctuates Even Though You Haven't Changed Anything
Compare only medians from multiple runs, never two individual measurements. Google states that Lighthouse scores can vary due to the volatility of the web and the network, even without any changes to the code. The documentation cites reasons such as changing ads and A/B tests, altered routing on the internet, and fluctuating server load. According to the Lighthouse documentation, small websites on shared hosting are typically more susceptible to server fluctuations.
We experienced this firsthand on September 29, 2026. A second measurement of our homepage on the same day yielded a result that was significantly different from the 69 recorded from the interface, even though nothing had changed on the page. If we had seen only the second number, we would have told a different story here. That is why our logs never contain a single value.
The location of the test isn't fixed either: According to Google, PageSpeed Insights reports results from North America, Europe, or Asia. If your median score fluctuates significantly over several days, check your hosting before making changes to the site itself. And if you want to compare results after making a change, measure five times before and five times after, ideally at similar times of day.
"No data": What to Do When Real User Data Is Missing
If it says "No data" at the top, this is normal for small businesses and is not an error. For field data, a page or website needs a minimum number of visits, and Google does not specify that number. Only certain Chrome users on desktop and Android are counted; Chrome on the iPhone is explicitly excluded.
Our own homepage is one of them; on September 29, 2026, the top section simply read “No data.” In our Cologne Skilled Trades Website Report dated September 11, 2026, out of 734 skilled trades websites analyzed, only 89 had any actual Chrome field data at all. For the vast majority of small businesses, the top section therefore remains empty; the figures are listed in the Cologne Skilled Trades Website Report.
In this case, open the “Core Web Vitals” report in Google Search Console. It uses the same data source but groups similar pages together, which is why its values sometimes differ from those of a single URL in PageSpeed Insights. You may also see “No data available” there—according to Google, this is either because the property is new or because the Chrome UX Report lacks sufficient data. We explain how to navigate Search Console in our article “How to Use Google Search Console Effectively.”
If the Search Console also shows no data, use the lab section—but with the correct value. We’ll then use the Largest Contentful Paint from the lab as our benchmark rather than the score, because it shows how long a visitor waits for the most important content. In the Cologne report, the median for this metric was 6.0 seconds; only 12.5 percent of pages managed to stay within 2.5 seconds. The median performance score was 69—exactly where we and handwerk.de ended up as well.
The Shoemaker and His Shoes: Testing Our Own Homepage
Open the “LCP Breakdown” statistics in the Labs section; it shows which element is causing your Largest Contentful Paint. For our homepage, it was a photo with a code resolution of 4160 × 6240 pixels. That’s the resolution of a camera—far more than the simulated cell phone screen in the test can display. Although our system serves downsized versions, PageSpeed Insights still estimates a potential savings of 1,073 KiB under “Improve image delivery.”
The breakdown shows four time segments: Time to First Byte 10 milliseconds, delay in loading resources 300 milliseconds, duration of the resource loading process 130 milliseconds, and delay in rendering the element 200 milliseconds. Don’t add these sub-times up to the 8.4 seconds, because according to the report, the value above is an estimate for a throttled cell phone. Use this to identify where the biggest bottleneck lies: In this run, it was the wait time before the image even began to load; the server responds quickly. Google notes that, ideally, most of the time should be spent on the loading process itself rather than on delays.
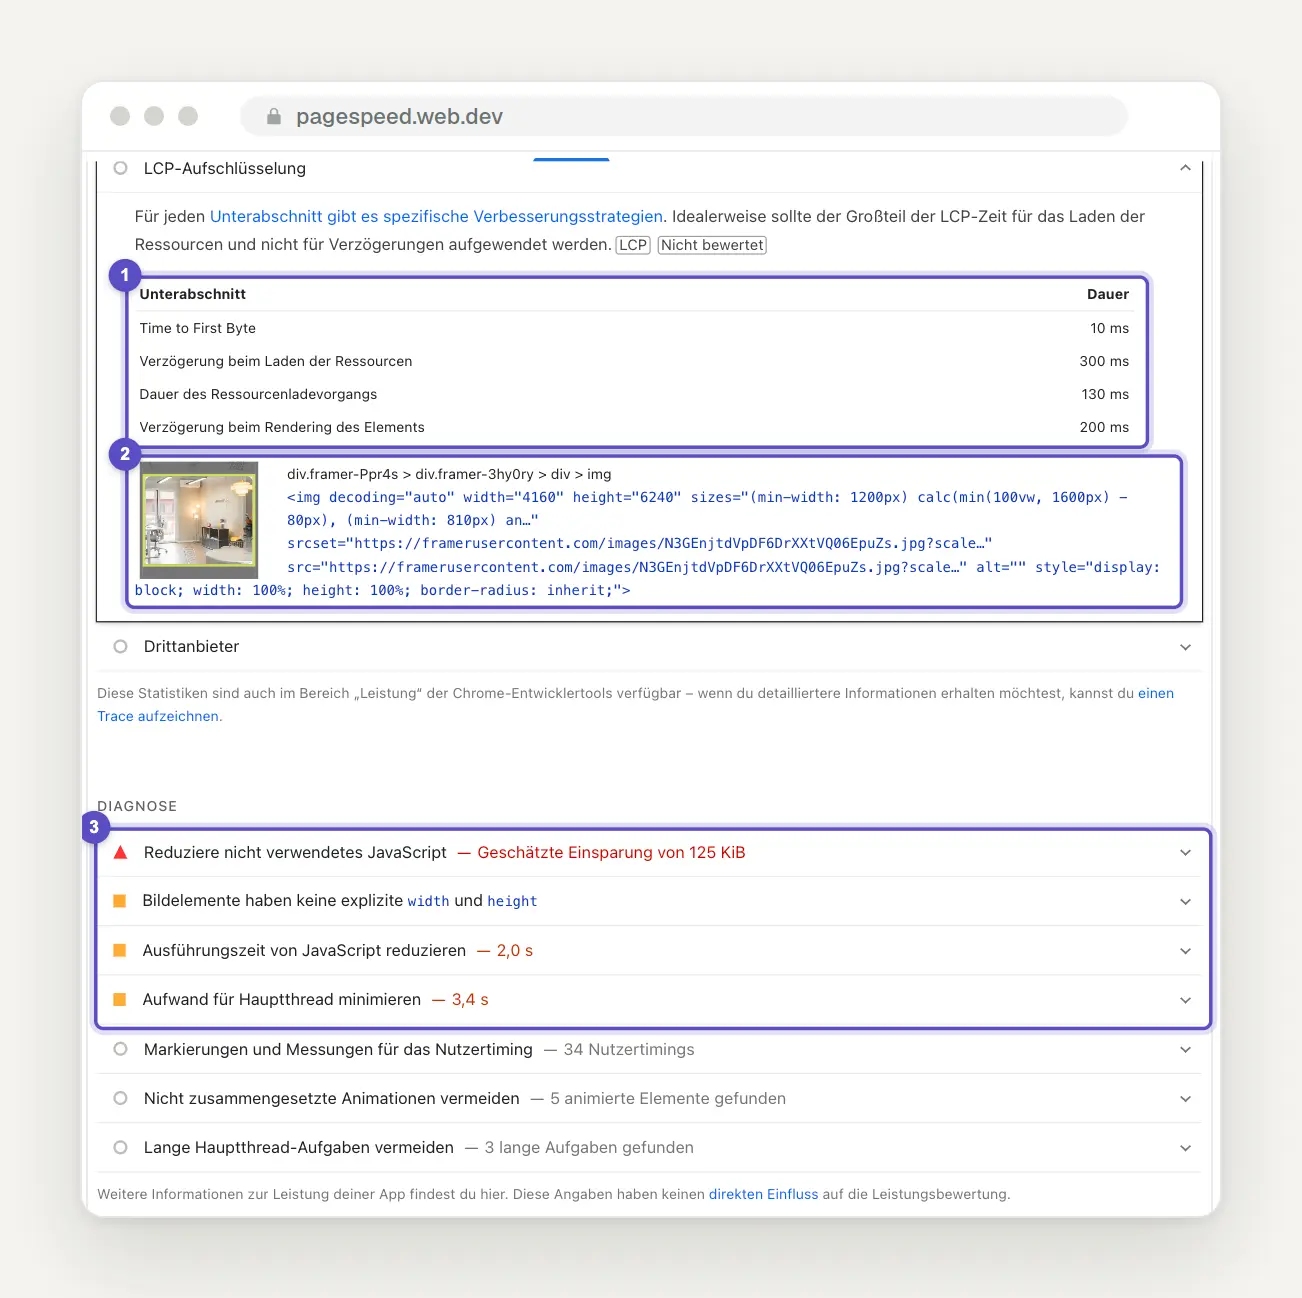
Our homework assignment in a nutshell: the LCP breakdown with its four sub-times (1), the triggering element—a photo with 4160 × 6240 pixels (2)—and, below that, the diagnosis showing 125 KiB of unused JavaScript, missing `width` and `height` attributes, 2.0 seconds of JavaScript execution, and 3.4 seconds of main thread execution (3).
We resized the photo on September 29, 2026, carefully measured it, and the lab value on the cell phone remained the same. The photo went from 4,160 × 6,240 pixels and 3.5 MB to 2,000 × 3,000 pixels and 0.87 MB. Before, PageSpeed Insights showed 58 points and a Largest Contentful Paint of 11.9 seconds in our measurements; afterward, it showed 57 points and 11.7 to 12.1 seconds. The reason is evident from the list of loaded files: The phone used in the test had previously loaded only a reduced version of about 120 KB because our content management system automatically delivers appropriate sizes. The biggest benefit went to visitors using computers with high-resolution screens, who had previously loaded up to 3.2 MB for this single image.
In the later runs, the delay was due to rendering, not the image itself. After the swap, this portion of the time was 1.6 to 1.9 seconds each time, while loading the image itself took 0.1 to 0.5 seconds. The unedited times recorded in the raw report are even more telling: The document was loaded after 0.8 seconds, but the first content wasn’t rendered until 2.3 seconds later, and the photo appeared at the same moment. As long as a page isn’t rendering anything at all, even the smallest image won’t help.
Next, the photo's fade-in effect came under suspicion, but it had an alibi. The image slides up as it loads and starts invisibly. We compared a copy of the home page without this effect to the original three times; both loaded in 2.3 seconds.
In the end, we disabled the translation script for the English version. It hid the page until the translation was ready—even on the German homepage, which isn’t translated at all. Since September 30, 2026, it has only been active on the English pages. In the five runs that followed, the page rendered three times earlier—after 0.3 to 1.3 seconds instead of 2.3—and twice it remained at 2.3 to 2.6 seconds. The median Largest Contentful Paint lab value was 11.8 seconds instead of 12.0, and the score was 60 instead of 57.
So the score hardly changes, even though the page loaded more than a second faster in three out of five runs. That’s exactly why it’s more worthwhile to look at the breakdown and the recorded times than to just look at the number in the circle. And yes, we’re keeping track of our own 60—the next update will be in this post.
For you, this means: When looking at the breakdown, don't just check which element is listed, but also which of the four sub-times is the longest. If it's loading, a smaller image is worth considering. If it's the rendering delay, the bottleneck lies in scripts, fonts, or effects that run before the initial rendering. Check your homepage today.
"Statistics" and "Diagnosis": Which lines should you tackle first?
Use the filter “Show audits relevant to the following metrics” to narrow down the list to the metric that’s costing you the most points. For us, that’s LCP, so we’ll click the LCP filter and see only the recommendations related to Largest Contentful Paint. Since the Lighthouse redesign, these suggestions are called “Statistics” in German; the former “Recommendations” no longer exist as a separate group.
Under “Statistics” on September 29, 2026, our entries included “Use Efficient Cache Lifetime” with an estimated 85 KiB, “Requests to Block Rendering” with an estimated 620 milliseconds, and “Improve Image Delivery” with 1,073 KiB. In addition, there were entries without numerical values, such as “LCP Request Detection” and “Network Dependency Tree,” which included a warning about having more than four `preconnect` links. The estimated savings provide a useful starting point for prioritizing your efforts.
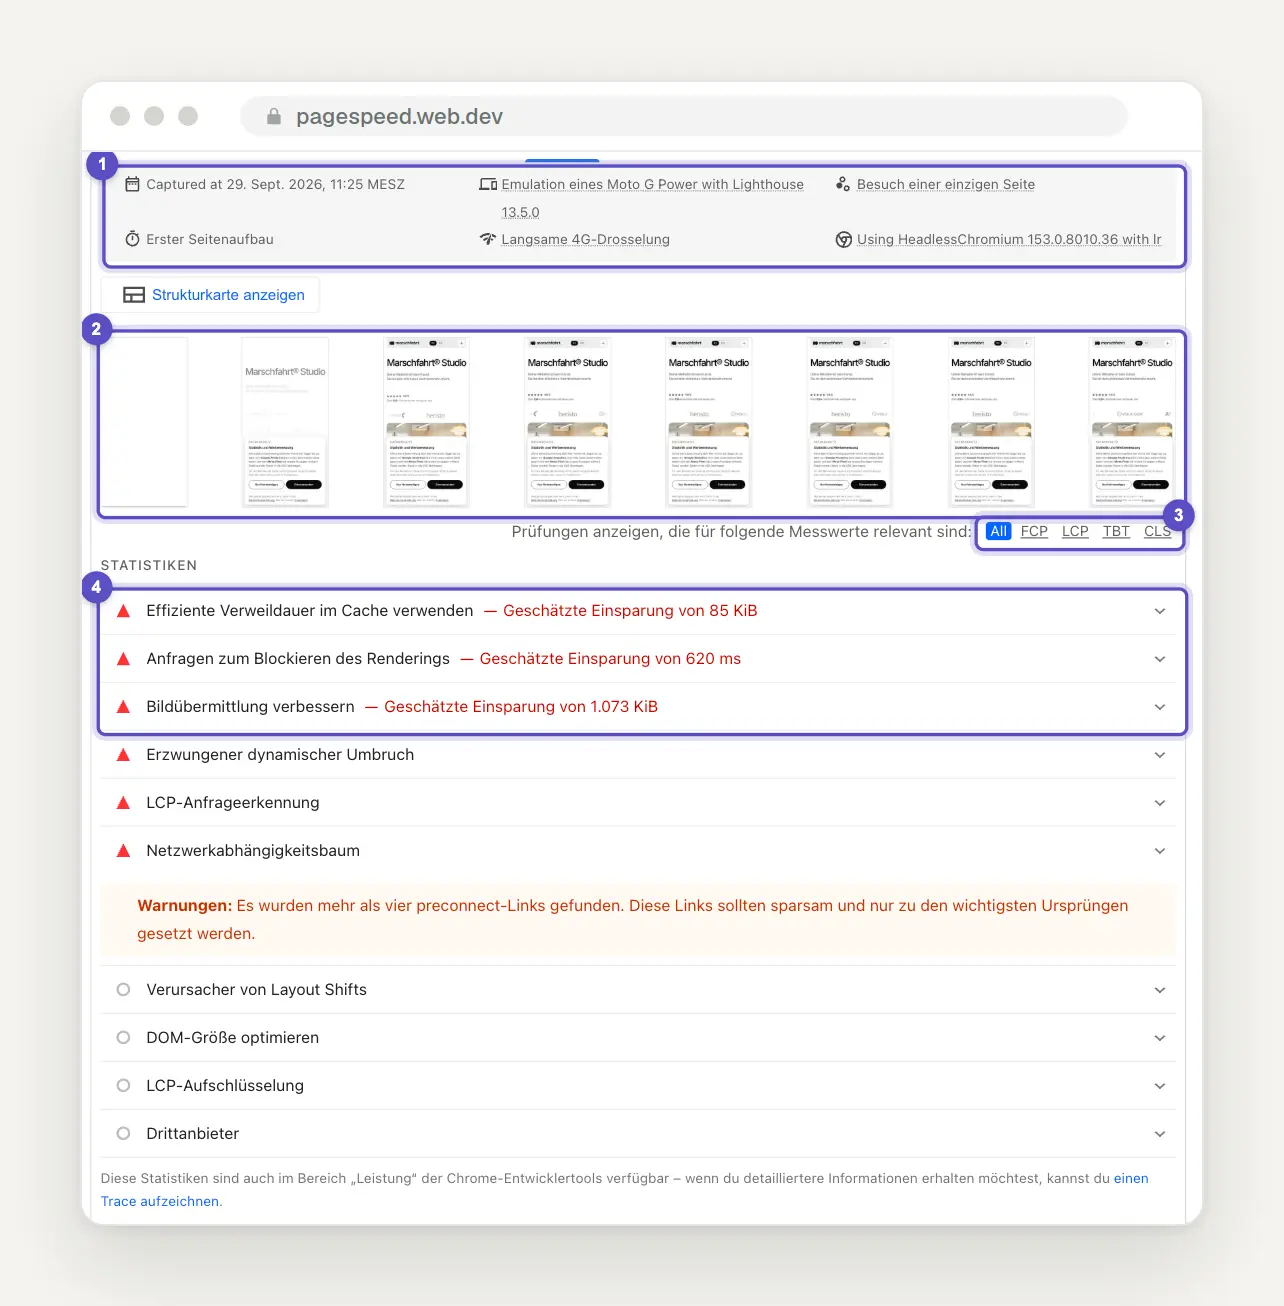
The lower section of our report: the test conditions using the Moto G Power, slow 4G throttling, and Lighthouse 13.5.0 (1); the charging progress bar (2); the filter by measurement values (3); and the three statistics showing estimated savings: 85 KiB cache, 620 ms blocking requests, 1,073 KiB images (4).
The “Diagnosis” section is the last one you’ll see. It states explicitly: “This information has no direct impact on performance evaluation.” Still, it’s not entirely irrelevant, because too much JavaScript slows down a page on low-end phones. But if you only have an hour, you’ll spend it on the statistics that fall into the worst performance category.
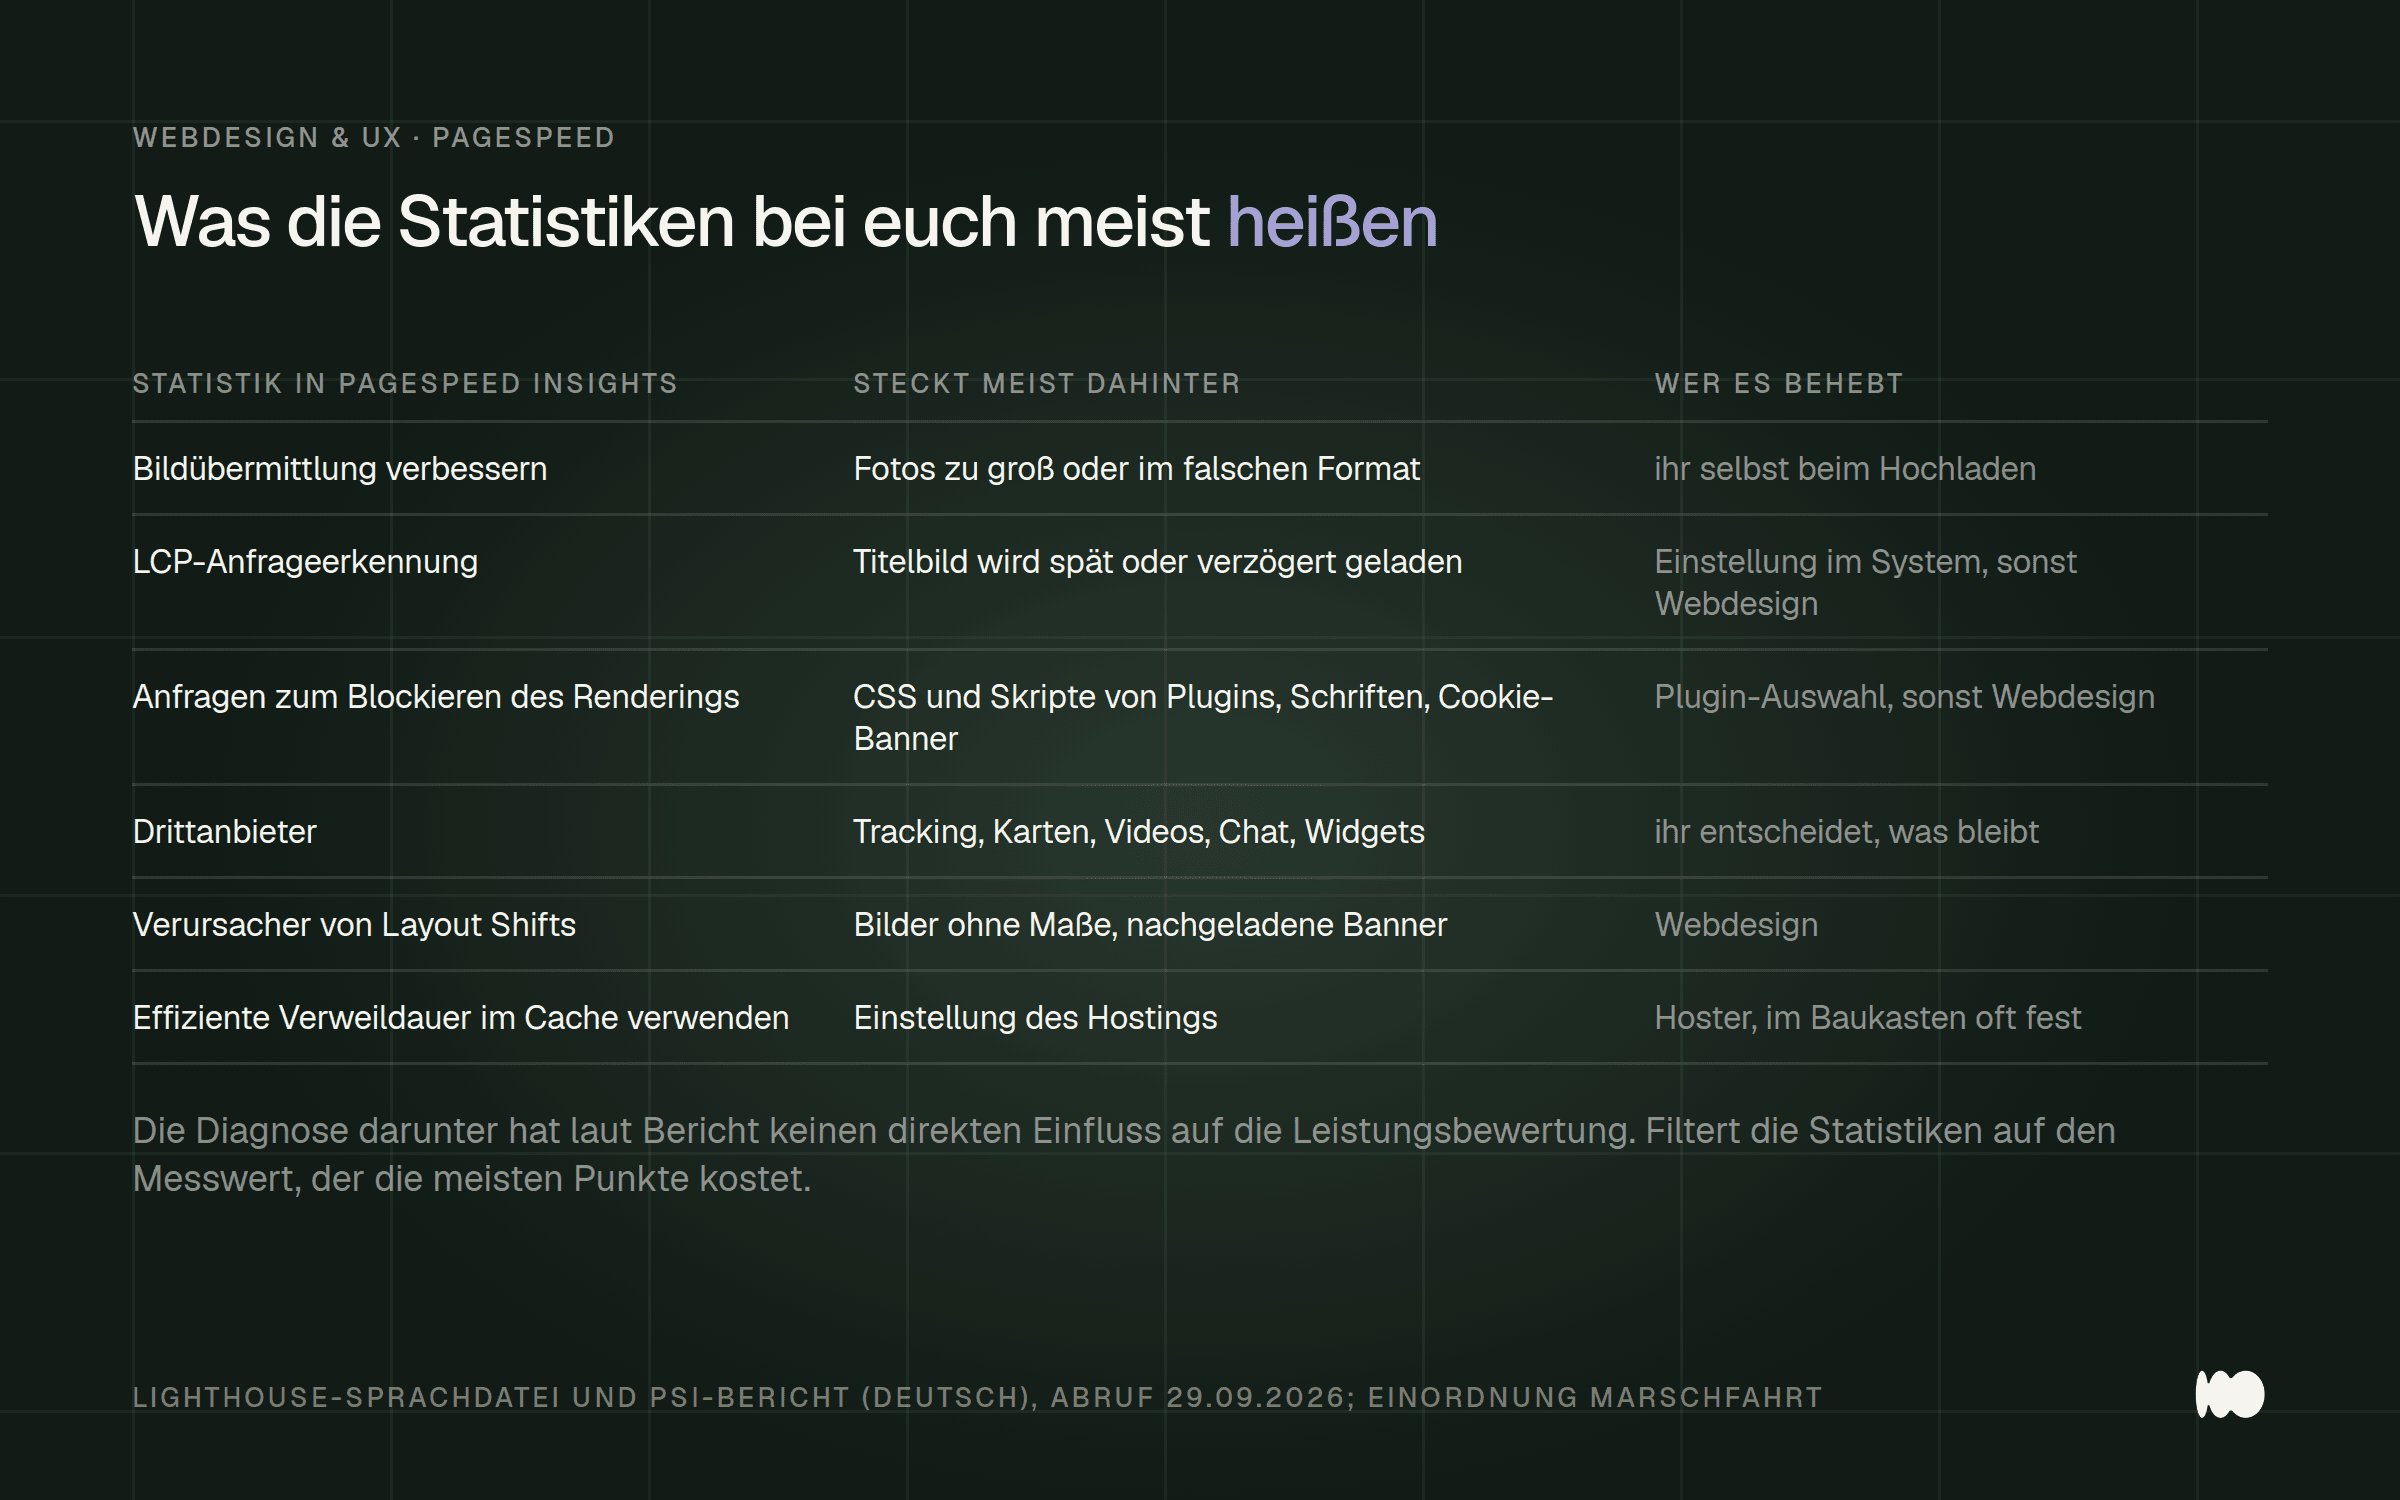
The statistics we see most often on small websites, explained in terms of what's behind them and who can fix them.
The three areas that almost always need work on small websites
Start with the images, then move on to blocking files, and finally third-party providers. This order is based on our experience measuring small websites, and it aligns with what Google says about the individual metrics. Images usually offer the quickest improvement because you can replace them yourself. Blocking files and third-party providers often require a decision or technical assistance.
Images: According to Google, the " Improve Image Delivery " metric identifies images whose shorter download times can improve Largest Contentful Paint. In practice, these include full-size mobile photos, large galleries, and photos in PNG format. This also involves LCP request detection: Google recommends making the image for the Largest Contentful Paint directly accessible in the HTML and not loading it lazily. If you add `loading="lazy"` to the cover image, you’re slowing down the very element that’s being measured.
Blocking Files: Requests that block rendering include stylesheets and scripts that the browser waits for before displaying anything at all. Google suggests deferring them or embedding them directly into the page so they are removed from the critical path. For small websites, these are often plugins, font services, and the cookie banner at the top of the page. For our site, PageSpeed Insights estimates a 620-millisecond improvement here—that’s our second point after the featured image.
Third-party providers: The " Third-party providers" statistics list code that does not originate from your own server. Google recommends reducing this type of code and loading it later so that your own content takes priority. Typical examples include tracking, maps, embedded videos, chat windows, rating widgets, and the cookie banner itself. Go through the list and ask yourself for each entry whether it still generates requests for you.
Cookie Banner: The lab only sees the first visit
Expect the lab test to measure your site before cookie consent is given, and test the behavior after consent is given separately. Google states on web.dev that most testing tools, such as Lighthouse, measure only first-time visitors who haven’t yet responded to the cookie notice unless a specific setting is configured. This is exactly what you’ll see in both reports from September 29, 2026: The preview shows a cookie banner at the top of the page for both our site and handwerk.de. The corresponding test condition in the report is called “First Page Load.”
This has consequences for websites subject to German data protection law. Tracking and marketing scripts usually load only after consent is given, so the lab generally doesn’t measure them at all. Real visitors who give their consent still experience them, and according to Google, cookie notices are often a reason for high INP values because many third-party scripts reload after consent is given. A good score can therefore mask a page that becomes sluggish after clicking “Agree.”
The banner itself also comes at a cost. Google cites cookie notices as a very common cause of layout shifts and notes that third-party banners generally slow down the page more than custom-built ones. Open your page in an incognito window, accept the cookies, and see if scrolling and typing become jerky afterward. If so, the list of services that are loaded later is the issue—not the score.
What Google Says, Word for Word, About Ranking
Treat Core Web Vitals as one signal among many, and do not consider the score a ranking factor. Google states on its German page about user experience, last updated on September 24, 2026: “Core Web Vitals are used by our ranking systems.” However, the same text also states: “Good results in reports such as the Core Web Vitals report in Search Console or third-party tools cannot guarantee that your pages will appear at the top of Google search results.”
Google is even more explicit here: “You probably have more important things to do than just strive for a perfect score for the sake of SEO.” Google cites the Chrome UX Report—that is, the field data from the top section—as the data source for this ranking factor. We haven’t found any statement from Google indicating that the Lighthouse score from the lab is factored into the ranking, nor does Google specify how heavily the Core Web Vitals are weighted.
For small businesses, this means: Without field data, your site won’t even have a Core Web Vitals score to pass or fail. It’s still worth speeding up your site, though, for the sake of visitors browsing on their phones. And relevance comes first—according to Google, Search always tries to show the most relevant content, even if a page’s user experience is below average in some respects. Focus your time first on content that answers your customers’ questions and on achieving a fast Largest Contentful Paint.
Accessibility, Best Practices, SEO, and Agent-Based Browsing in Five Minutes
Consider the remaining categories as a list of obvious errors, not as a seal of approval. On September 29, 2026, our homepage scored 97 for accessibility, 100 for best practices, and 100 for SEO, while handwerk.de scored 96, 96, and 100, respectively. These scores have nothing to do with the Core Web Vitals; they come from our own Lighthouse audits, with best practices falling into categories such as “Trust and Safety” and “Browser Compatibility.” For each circle below 100, click on the failed tests and fix whatever can be fixed quickly.
When it comes to accessibility, Lighthouse itself states that automatic detection doesn’t catch all issues and that manual testing is recommended. So a score of 97 doesn’t mean your site is accessible. Regarding SEO, Lighthouse notes that it only checks basic recommendations and doesn’t evaluate many factors that can influence rankings at all. A score of 100 there is a baseline, not a ranking.
A new category is “Agent-Based Browsing.” It was introduced in May 2026 with Lighthouse 13.3 and appeared in our interface on September 29, 2026—with a score of 1/2 on our site and 2/2 on handwerk.de. The category is described as still being in the development phase, so it may change. Take a look, note the score, and hold off on making any changes until Google provides a more detailed explanation of what factors are considered there.
Things You Can Do Yourself on Wix, Jimdo, and WordPress
Resize any large photo to the width at which it will appear on the page before uploading it. Photos taken with a cell phone camera often have a side length of several thousand pixels; our own header image was originally 4160 × 6240 pixels. This reduces data usage for all visitors, but it only improves Largest Contentful Paint if loading is the largest time component in the breakdown. Save photos as JPG or WebP instead of PNG, and start with the homepage’s featured image.
Remove any embedded content you no longer need. Maps, videos, social media feeds, chat windows, and review widgets typically load third-party code, and the “Third-Party” statistic shows you exactly that. On Wix and Jimdo, these are often apps or elements that were added at some point and then forgotten. When a map is only meant to show directions, an image with a link to a route planner is often sufficient.
In WordPress, deactivate plugins and check for delayed loading of the first image. Any plugin that places scripts or stylesheets in the page header may appear under “Requests that block rendering.” If a plugin delays the loading of images, exclude the featured image from this, because Google advises against delayed loading for the LCP image. Set `fetchpriority="high"` to this one image at most, because according to Google, high priority no longer helps if you apply it to more than one or two images.
The following applies to all systems: use few font styles, and where settings allow, set `font-display` to `swap`—this is what Google recommends in its Font Display Statistics. The cache duration set via “Use Efficient Cache Lifetime,” on the other hand, depends on your hosting provider; with website builders, you usually can’t change it yourself, and with WordPress, you’ll need to ask your host. In our Cologne-based comparison, the median performance scores were 64 for WordPress, 70 for Wix, 69 for Jimdo, and 69 for TYPO3; the details can be found in the loading time comparison of WordPress, Wix, Jimdo, and TYPO3. So the system itself matters less than what you put into it.
Conclusion: today, this week, later
Today, measure your homepage and your most important performance page five times each on mobile and note the median of the score and Largest Contentful Paint. Then check the top section: If there’s a score listed, count it; if it says “No data,” check Search Console. Finally, open the LCP breakdown and write down which element is listed there.

The order of topics in this post: measurements and readings today, the cover image and third-party providers this week, and later on, the topics you might need help with.
This week, replace the cover image with a appropriately resized version, remove it from the delayed loading section, and go through the list of third-party providers. Also, check in a private window to see how the page behaves after you accept the cookie banner. Then measure it five more times and compare the medians.
Later on, we’ll cover topics where you might need help: blocking files, fonts, cache, and hosting. If you have field data, it can take up to 28 days for the improvement to be fully visible at the top, because that section always summarizes the last 28 days. If you want to keep track of your mobile and desktop performance without creating your own spreadsheet, you can use our free Speed Check, which measures performance via the same PageSpeed interface, displays mobile and desktop results side by side, and explains the metrics.
If you don’t want to do this yourself, we can do it for you at a fixed price. The Speed Package for €95 (net) is designed for business websites with up to 15 subpages: resizing images and delivering them in modern formats, setting up caching and compression, removing unnecessary scripts and plugins, embedding fonts locally, preloading the header image, plus a before-and-after report with Google metrics. The Speed Package Plus for €295 net is aimed at online stores and larger sites with up to 60 subpages, including a hosting audit, optimization of all pages (not just the homepage), and three months of monitoring. With the Plus package, if the mobile score doesn’t increase by at least 20 points, you pay nothing—except for website builders like Wix or Jimdo.
We know how that sounds after the section about our own homepage. That’s exactly why we measure results before and after and send you the report, instead of just promising you a nice number.
What Has Changed and What That Means for You
March 12, 2024: "Interaction to Next Paint" has replaced "First Input Delay" as a Core Web Vital. For you, this means that guides explaining FID are now outdated, and there is no direct metric for response time in the lab; "Total Blocking Time" serves only as a substitute there. FID disappeared from Search Console immediately, while PageSpeed Insights was given a six-month transition period.
April 28, 2025: Google announced that it would replace the existing Lighthouse audits with Insights. For you, this means that the “Recommendations” section from older guides no longer exists as such; you’ll find the guidance under “Insights” and “Diagnostics.”
October 10, 2025: Lighthouse 13 removed the old metrics from reports and data; according to Google, PageSpeed Insights should follow within a week. For you, this means: Screenshots taken before this date often show entries that you can no longer find. The weighting of the score remained the same: TBT 30, LCP 25, CLS 25, FCP 10, and Speed Index 10.
May 7, 2026: Lighthouse 13.3 introduced the “Agent-based Browsing” category. For you, this means there’s an additional value in the report that’s still labeled as “under development.” Make a note of it, but don’t make any changes based on it.
September 18, 2026: Lighthouse 13.5 was released; on September 29, 2026, PageSpeed Insights ran our tests using Lighthouse 13.5.0. For you, this means: Make a note of the version listed in the test conditions for each measurement so that you’ll know later what you’re comparing.
September 24, 2026: Google most recently updated its German page on user experience; the ranking quotes above are taken from this version. For you, this means: Core Web Vitals matter, but you don’t necessarily need a perfect score. The thresholds for LCP, INP, and CLS themselves have not changed since March 2024. As of this version: September 30, 2026.
Do you want to know what's really slowing down your site?
Write to us—we’ll go over the report with you and let you know which two or three issues are worth tackling first. Most of the time, it’s a cover image that’s too large, a few embedded elements that no one needs anymore, and a cookie banner that loads more than necessary. As you’ve read, in our case it was a translation script—you never stop learning. Before you do that, you can test your site’s speed in just a minute using the Speed Check.
Just send us a quick message through our contact form —your domain name is all we need to get started. We’ll respond within 24 hours, personally and without any sales pitch.
More Articles
© Marschfahrt Studio
Practical knowledge on web design, SEO, AI, and conversion optimization. Based on real projects, without any marketing spin.