Cologne-Based Trades Websites Put to the Test: Only One in Eight of 734 Loads Fast Enough on a Cell Phone
On September 11, 2026, we used Google Lighthouse to measure the mobile performance of 734 craft and trade businesses in the Cologne area: Only 12.5 percent display their main content in 2.5 seconds or less. The report highlights phone links, accessibility, and SEO basics by trade and platform, openly acknowledges the limitations of the measurement, and tells you what you can change in a week.
Date
Category
Author

“Is our website actually bad, or are they all like this?” This is the kind of question small business owners ask us when we look at their website together for the first time. We wanted to provide an answer backed by data, so on September 11, 2026, we used Google Lighthouse to evaluate the websites of 734 craft and trade businesses in the Cologne area on mobile devices.
The result: Only 12.5 percent display their main content within 2.5 seconds—the threshold that Google considers acceptable. That’s one in eight pages. Only 43 percent of the accessible pages have a phone number that can be tapped on a cell phone. And 62.4 percent fail the automated accessibility test due to insufficient contrast.
So the answer to the original question is: The vast majority are like that. That’s why anyone who gets the basics right already stands out. This report, as of September 2026, outlines the methodology and limitations, highlights differences by trade and system, and shows what you can change in a week.
Key Findings at a Glance
In our test conducted on September 11, 2026, the 734 measurable websites (752 were accessible; 734 provided a valid measurement) achieved a median load time score of 69 out of 100 points on mobile devices. The main content appears, on average, only after 6.0 seconds; for 36.1 percent of the sites, it takes longer than 8 seconds. Of the 752 accessible pages, only 37 percent display a phone number in the top third of the page, and we found a contact form on 31 percent of them.
For accessibility, the median score is 88 points, but 62.4 percent of the pages have contrast issues and 50.3 percent have links without recognizable names. SEO fundamentals fare best, with a median of 92; nevertheless, 36.1 percent of the pages lack a meta description. Only 16 out of 734 pages—2.2 percent—achieve at least 90 points for load time and accessibility, plus a clickable phone number.
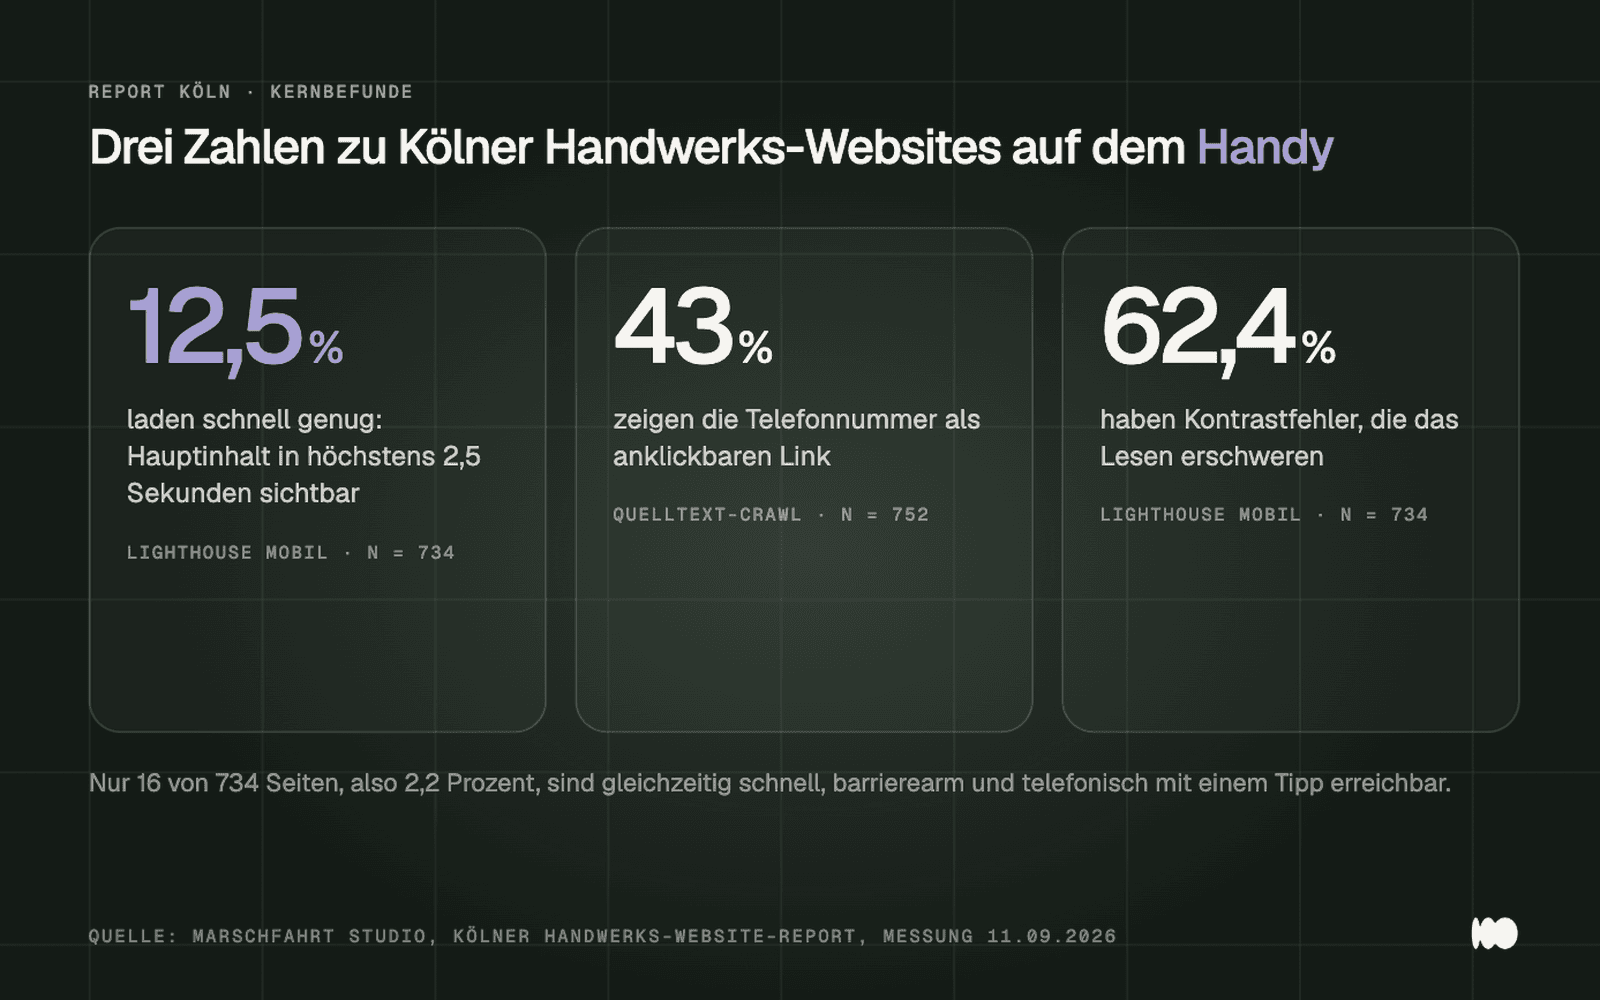
The three key findings from our measurement on September 11, 2026: load time and contrast based on 734 Lighthouse measurements, and the phone link based on the crawl of 752 accessible pages.
The full report as a PDF: All figures, charts, and methodology on ten pages—for printing, sharing, and citing. Download the report (PDF, 1.8 MB)
Here's how we measured it
The addresses come from OpenStreetMap, the free world map. We retrieved all entries for skilled trades as well as for bakeries, butcher shops, hair salons, florists, opticians, and auto repair shops within a rectangle surrounding Cologne, between 50.78 and 51.10 degrees north and 6.75 and 7.25 degrees east. Out of 1,158 entries, 938 unique websites remained after removing chains whose domain appeared at least three times.
Of these, 752 were accessible. For 62 of the remaining 186, the domain no longer existed, which may also be due to outdated map listings. We measured the accessible pages on September 11, 2026, using Google PageSpeed Insights (Lighthouse) on mobile devices: 734 measurements were valid. In addition, we automatically scanned the source code of the 752 pages for phone links, forms, legal notices, and system information.
These limitations are inherent in the data. The sample includes only businesses listed on OpenStreetMap with a website; it is not representative of all businesses, and hair salons, auto repair shops, and bakeries are overrepresented in it. For 289 entries, no location is specified; they are only located within the rectangle based on their coordinates. Lighthouse performs a one-time measurement in the lab using a simulated smartphone; individual values fluctuate by a few points, and real usage data from Chrome was available for only 89 of the 734 pages.
Furthermore, an automated accessibility check only identifies some of the problems. We detect phone links and forms by looking for patterns in the source code, but we sometimes underestimate the number of issues on pages that reload content via JavaScript. The figures therefore show a clear trend, not official statistics.
Mobile loading times: Only one in eight pages loads fast enough
The most important metric is called Largest Contentful Paint, or LCP for short: the moment when the largest visible element has finished loading, usually the featured image or the main headline. Google considers a time of up to 2.5 seconds to be good. According to our measurements, 12.5 percent of the 734 pages meet this standard. 70.4 percent take longer than 4 seconds, and 36.1 percent take even longer than 8 seconds.
The load time score that Lighthouse assigns on a scale of 0 to 100 paints a more favorable picture: median 69, average 70.3. 17.3 percent score 90 or higher, 73.2 percent fall between 50 and 89, and 9.5 percent score below 50. So most pages aren’t broken—they’re just mediocre.
The measurement does not directly reveal the cause, but the other values provide some insight. Blocking scripts are rarely the problem: 86.2 percent have a blocking time of 200 milliseconds or less, and 82.8 percent have virtually no jumping content, with a shift value of 0.1 or less. File size, on the other hand, is a major issue. Median page size is 1.55 MB; 26.6 percent of pages are larger than 3 MB, and 15.5 percent are larger than 5 MB.

Percentage of the 734 pages measured based on the time it takes for the main content to load on a mobile device, as measured by Lighthouse Mobile on September 11, 2026; pages taking more than 8 seconds are included in those taking more than 4 seconds.
In our projects, the most common cause is a splash screen that was uploaded directly from the camera and is intended for a large monitor. Our Speed Check shows you how your site is performing: It analyzes your site in 60 seconds.
If you want to call someone, you have to look them up
For many small businesses, a phone call is the most important way to get a job. Our crawl of the 752 accessible pages shows that only 43 percent have listed their phone number as a “tel:” link that can be dialed with a single tap on a cell phone. Only 37 percent display the number in the top third of the page. Anyone who wants to call has to scroll through other pages, write down the number, or copy it.
For comparison: Facebook is linked on 44 percent of the pages, Instagram on 39 percent, and WhatsApp on 23 percent. The link to Facebook is thus slightly more common than a clickable phone number. We found a contact form on 31 percent of the pages, but our crawl does not always detect embedded forms from external services.
When we go through a business owner’s website with them on a cell phone, that’s often the first thing we notice: The phone number is only listed in the footer or on the contact page, as text that can’t be tapped. You can find more common pitfalls in our article about the UX mistakes that cost business websites leads.
The required information, on the other hand, is usually present: We found a legal notice on 88 percent of the pages and a privacy policy on 83 percent. Because this information is also identified using patterns, there may be text present that we did not find.
Accessibility: Contrast is the most common problem
In Lighthouse's automated accessibility test, the pages in our analysis achieved a median score of 88 points. 43.5 percent scored 90 or higher, while 7.8 percent scored below 70. That sounds decent, but the automated test only identifies some of the accessibility barriers.
The most common errors: 62.4 percent have text with insufficient contrast—typically light gray text on a white background or white text on photos. 50.3 percent have links without recognizable names—often icons for phones or social media that a screen reader reads aloud only as “link.” 39.4 percent have headings that appear out of order, 20.8 percent have clickable areas that are too small, and 20.0 percent have images without alternative text.
A mistake is made intentionally, often right in the theme: 18.9 percent disable zooming on mobile devices. People with poor eyesight are then unable to enlarge the text. In addition, 11.6 percent of pages have buttons without labels, and 9.5 percent lack language information.

Percentage of the 734 pages containing the respective error in Lighthouse's automated accessibility test, as measured on September 11, 2026.
Whether your business is legally required to ensure accessibility depends on what you offer online and the size of your business. We explain this in our article on the Accessibility Enhancement Act.
SEO Basics: Technically Sound, With Two Gaps
Lighthouse also checks technical fundamentals for search engines, such as whether a page has a title, is readable by Google, and whether its links can be followed. In our measurements, these pages perform the best: a median score of 92, and 76.2 percent score 90 or higher. 92 percent of the accessible pages use an encrypted HTTPS connection.
Nevertheless, two gaps are common. 36.1 percent lack a meta description—that is, the short text that Google can display in search results below the title. If it’s missing, Google selects a text snippet on its own, which sometimes says little about the business. 17.2 percent contain links that search engines cannot follow, often because they are created using scripts rather than as normal links.
However, a good score simply means that the technology isn’t getting in the way. Whether you show up on “Elektriker Köln” depends on your content, your Google Business Profile, and your reviews—and our metrics don’t take those into account.
Differences by Trade
There are significant differences by trade; all values are medians. In our measurement, electrical contractors were the fastest, with 29 pages, a load time score of 80, and an LCP of 4.7 seconds, followed by painters with 17 pages, 77 points, and 4.5 seconds. The slowest are opticians, with 62 pages, 64 points, and 7.8 seconds, followed by hairdressers and plumbing and heating contractors, each with 7.1 seconds.
No trade group achieved a median time of 2.5 seconds, which Google considers good. When it comes to clickable phone links, roofers lead the way at 58 percent, followed by plumbers and heating specialists at 57 percent, and auto repair shops and opticians at 56 percent each. An obvious explanation: Customers often call these businesses with urgent matters.
The link is least common at florists (23 percent) and bakeries (24 percent), whose customers usually visit the store in person anyway. Hair salons, the largest group with 132 pages, stand at 42 percent. We did not analyze whether online appointment bookings replace phone calls in those cases.

Median load time, median LCP, and percentage of clickable phone numbers for twelve industries, based on our measurement on September 11, 2026.
For small groups such as painters or roofers, just a few entries can skew the median. Therefore, please interpret these figures as a general trend, not as a ranking.
Differences by System: WordPress, Website Builders, and the Rest
WordPress is the most common platform: 43 percent of the accessible pages run on it, while Wix accounts for 4 percent, Jimdo for 3.5 percent, and TYPO3 for 2.7 percent. In terms of load time, the 310 WordPress sites measured—with a median of 64—outperform Wix (70, based on 32 sites) as well as Jimdo and TYPO3 (both 69, based on 26 and 17 sites, respectively). Joomla and Webflow each recorded 74, based on only 16 and 9 sites, while Squarespace recorded 54, based on 12 sites. The 306 pages using other systems averaged 76.
This is a correlation, not a judgment on the systems themselves. WordPress isn't inherently slow. However, in our experience, a particularly large number of older sites run on it, using themes and plugins that have been added over the years. We didn't measure the age or maintenance status of the sites, but these factors likely account for a significant portion of the difference.
For Squarespace, Webflow, and Joomla, the groups are too small to draw any reliable conclusions. The system provides the framework; what matters is what you put into it.
What the Top 2.2 Percent Do Differently
We counted how many pages meet all three of the following criteria: a page load time score of at least 90 points, an accessibility score of at least 90 points, and a clickable phone number. Sixteen out of 734 pages meet these criteria—that is, 2.2 percent. We are deliberately not naming any specific sites.
Taken individually, these criteria are not unusual: 17.3 percent meet the loading time standard, 43.5 percent meet the accessibility standard, and 43 percent include the phone link. It is only when these factors are combined that issues rarely arise. Many sites have addressed one aspect well but have overlooked the others.
What these 16 pages have in common is evident from the criteria: minimal loading time, readable contrast, labeled controls, and a number you can tap. None of this requires a complex design. In our experience, pages like these are created when someone regularly navigates through them on their own cell phone.
Because Lighthouse scores fluctuate by a few points, individual sites may be added or removed in a second measurement. This does not change the fact that such sites are the exception in the Cologne area.
What You Can Change in a Week
The numbers suggest a certain order: first, what directly addresses inquiries; then, what yields significant improvements with minimal effort.
Monday: Phone. Add your number as a "tel:" link in the header so it's visible on a cell phone without scrolling, and test it on an actual cell phone. According to our data, only 37 percent of pages currently display the number in the top third.
Tuesday: Images. Resize the largest images to their actual display size and save them in a compressed format, such as WebP. Avoid using sliders and background videos where they aren’t necessary. This step is especially worthwhile for the 26.6 percent of pages larger than 3 MB.
Wednesday: Contrast and captions. Make light gray text darker, add a darkened background beneath text in photos, provide names for icon links so screen readers can read them, and add any missing alternative text. This covers the two most common errors identified in our assessment.
Thursday: Zoom and language. Remove the “user-scalable=no” setting or a low “maximum-scale” value from the page header, and check whether the page is marked as German-language. Both tasks take a few minutes and affect 18.9 and 9.5 percent of the pages, respectively.
Friday: Meta descriptions and testing. Write a separate description for the homepage and each of the main service pages that explains what you do and where. Then run another test: Our Speed Check analyzes your site in 60 seconds and shows whether the load time has improved.
For the press and trade associations: The figures in this report may be cited provided that the source is credited as “Marschfahrt Studio, Cologne Crafts Website Report 2026” and a link to this article is included. We will provide the raw data upon request.
Related: Web Design Trends for 2026: What Stays and What’s Already on Its Way Out, and Storytelling in Web Design Isn’t a Gimmick, but Structure · Services: Web Design for Small and Medium-Sized Businesses and Trades
Want to know how your site stacks up against the competition?
Send us the link. We’ll compare your site to the 734 Cologne-based sites in this report and let you know how it stacks up in terms of load time, phone link, accessibility, and basic SEO—and what needs to be addressed first. Send us a quick message using the contact form. We’ll respond within 24 hours, personally and without any sales pitch.
More Articles
© Marschfahrt Studio
Practical knowledge on web design, SEO, AI, and conversion optimization. Based on real projects, without any marketing spin.