WordPress, Wix, Jimdo, TYPO3: Which system loads the fastest in Cologne? 736 websites tested
Only 12.5% of Cologne-based company websites load quickly on mobile devices. The system accounts for part of this, while the page structure accounts for the larger portion.
Date
Category
Author

“We’re redesigning the site. Should we go with WordPress again, or is Wix faster?” This question comes up in almost every initial consultation before a relaunch, usually accompanied by a firm opinion: that WordPress is slow, website builders are fast—or vice versa.
We measured instead of guessing. On September 11, 2026, we tested 736 Cologne-based trade and business websites using Google PageSpeed Insights, both on mobile devices and in a lab setting. Here’s the bottom line: No widely used system loads reliably fast in Cologne. Only 12.5% of all 736 homepages display their largest visible element on the screen in 2.5 seconds or less.
There are measurable differences between the systems. WordPress has 4.5% fast pages, Wix has 3.1%, IONOS MyWebsite and TYPO3 have none, and sites without a recognizable system account for 26.7%. The biggest difference, however, lies within a single system: the fastest 10% of WordPress sites load in a median of 2.6 seconds, while the rest load in 8.1 seconds (as of September 2026). This article covers the ranking, the metrics for each system, the reasons behind them, and what this means for your choice of system.
What We Measured—and What We Didn't
The data is based on the 736 websites from our 2026 Cologne Skilled Trades Website Report. Each homepage was tested using the Google PageSpeed Insights API in mobile mode. PageSpeed Insights runs Lighthouse, which simulates a mid-range smartphone on a throttled cellular network. This is a lab measurement with an empty cache; it does not reflect actual visitor traffic.
The key metric is Largest Contentful Paint (LCP), which is the moment when the largest image or text block in the visible area is rendered. On web.dev (updated September 2025), Google classifies 2.5 seconds or less as good and more than 4.0 seconds as poor. We use these thresholds. The server response time is derived from our own crawl, while the weight and requests are taken from the Lighthouse report.
Limitations: We were able to identify the system on 65.4% of the pages using the generator tag and known source code patterns. We only mention systems with fewer than 15 measurements as a side note. Across all 736 pages, the median LCP is 6.1 seconds, the 75th percentile is 10.0 seconds, 70.5% are poor, and 62% take longer than 5 seconds.
We need to point out one distortion: 31 of the 736 homepages load less than 100 KB and make one to four requests; these are placeholders and construction pages. They remain in the sample because the report includes them, and they all count as fast. Excluding them, the percentage of fast pages is 8.7% instead of 12.5%; wherever they distort the picture, we point it out.
The Ranking: Which System Loads the Fastest Most Often
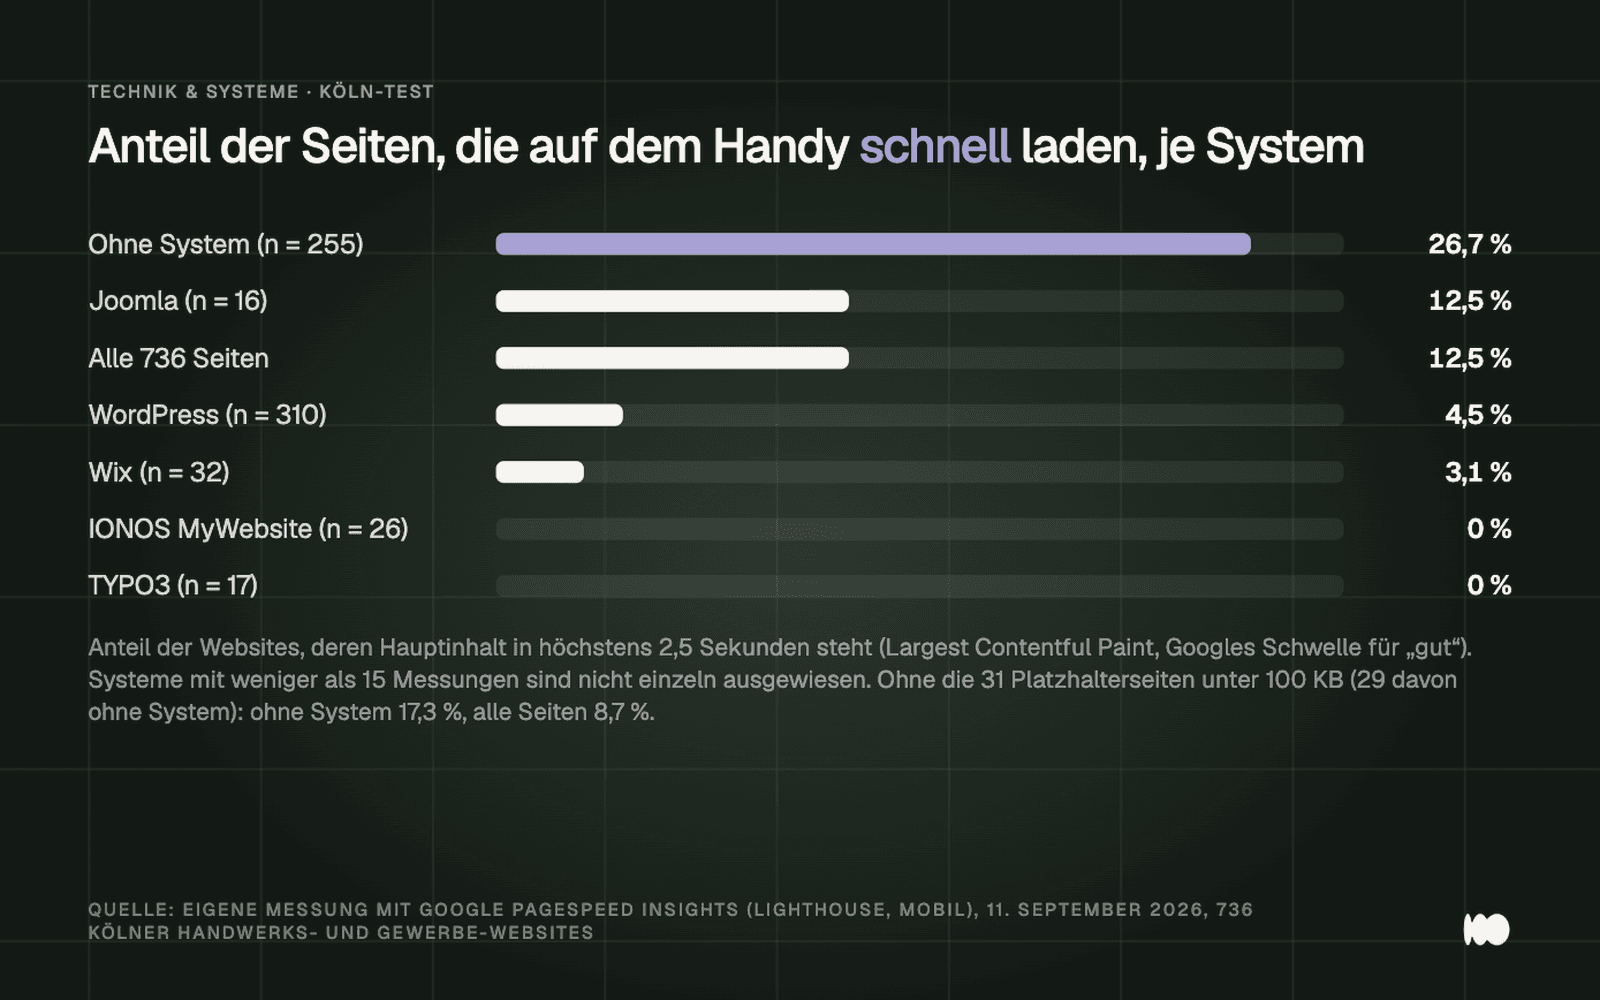
Percentage of Cologne homepages with an LCP of up to 2.5 seconds per system, Lighthouse Mobile, September 11, 2026.
Leading the pack are the pages with no discernible pattern, accounting for 26.7% of fast-loading homepages out of 255 measurements. Twenty-nine of the 31 placeholder pages fall into this group; excluding them, the figure is 17.3% out of 226 pages—still the highest value. The 40 pages under “Other” account for 15.0%; Joomla, with 16 pages, achieves 12.5%—exactly the average of all 736.
WordPress, with 310 pages, comes in at 4.5 percent, while Wix, with 32 pages, comes in at 3.1 percent. IONOS MyWebsite (26 pages) and TYPO3 (17 pages) do not have a single homepage that loads in under 2.5 seconds.
Side note on the small groups: We found that Jimdo had 11 pages, none of which loaded in under 2.5 seconds. Webflow (9 pages after the Generator tag, 10 in the second test below), Contao (7), Squarespace (6), Drupal (5), and Framer (2) also fall below the minimum of 15 measurements. Percentages are not relevant for comparison in these cases.
Weight, Requests, Server Response: Where the Seconds Are Lost
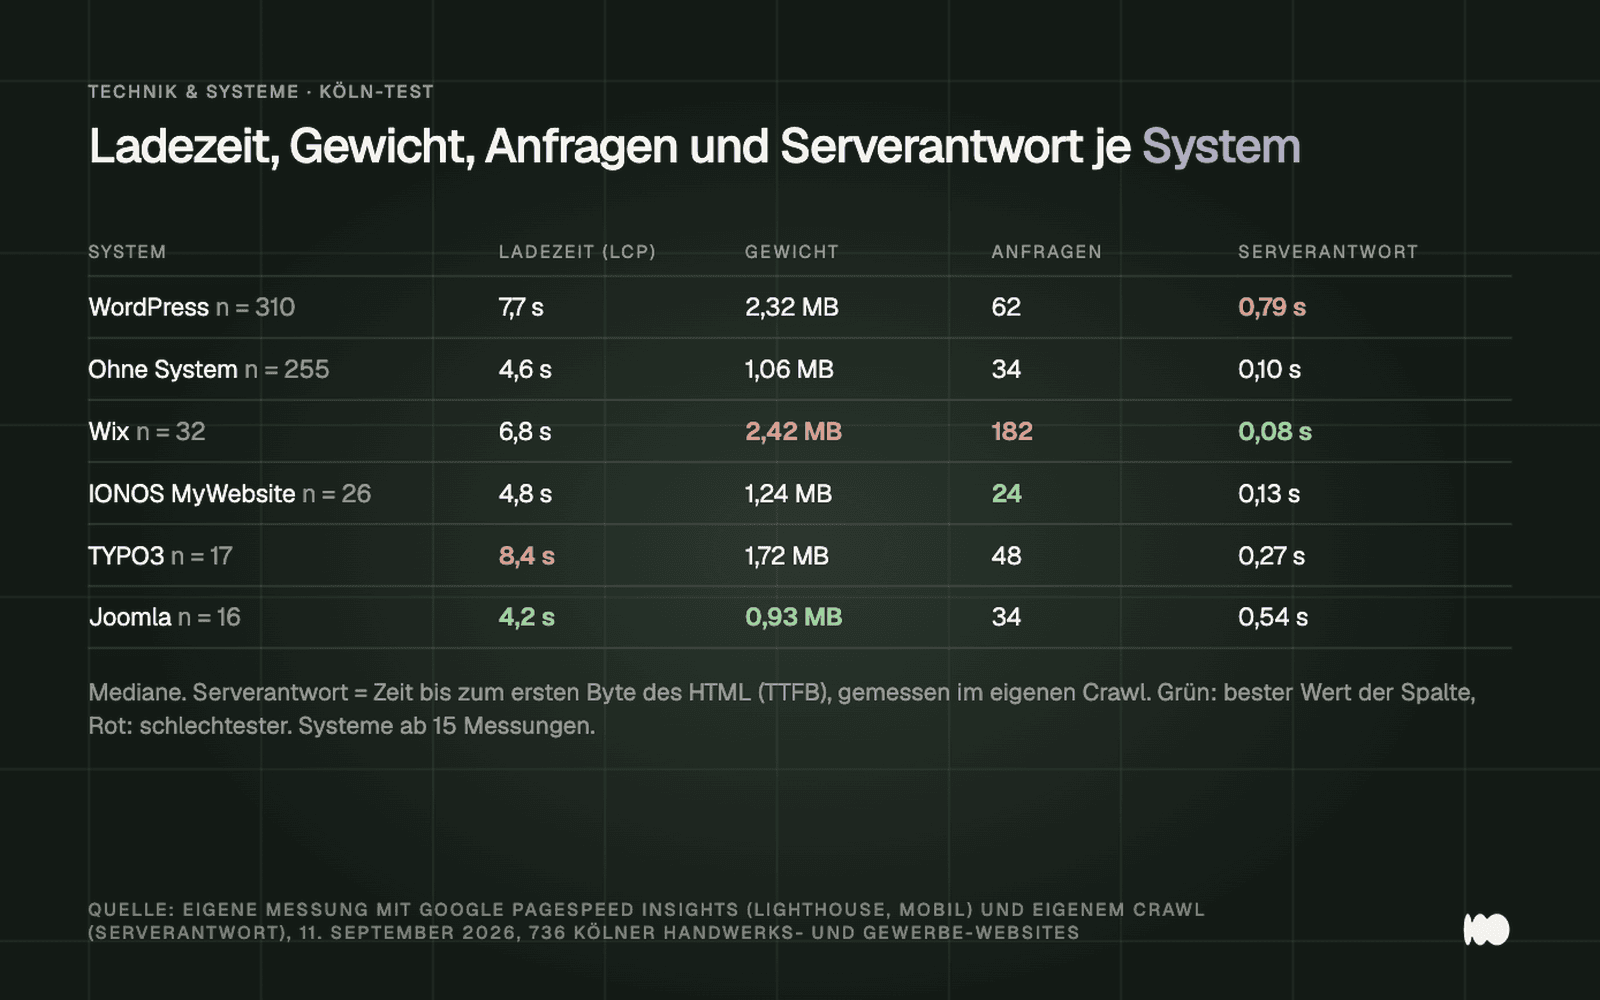
Median values per system from our measurement on September 11, 2026: load time (LCP), page weight, and number of requests from Lighthouse; server response from our crawl.
Page size: Of the three platforms, this metric most closely follows the ranking. The median size for WordPress homepages is 2.32 MB, for Wix pages 2.42 MB, for pages with no identifiable system 1.06 MB, and for Joomla 0.93 MB. One exception is IONOS MyWebsite: 1.24 MB, and yet it’s not a fast page. Across all platforms, 42% of Cologne-based sites exceed 2 MB.
Requests: Wix stands out with a median of 182; WordPress is at 62, and sites without a discernible system are at 34. The Web Almanac 2025, in its “Page Weight” chapter (data from summer 2025), reports a worldwide median of 72 requests and 2,362 KB for mobile homepages. The WordPress sites in Cologne fall below this average and are still slow.
Server response: It rotates the image. The hosted website builders respond very quickly in our crawl: Wix in 0.08 seconds, IONOS MyWebsite in 0.13 seconds. WordPress takes a median of 0.79 seconds for the first byte to arrive. On web.dev (updated November 2025), Google considers values up to 0.8 seconds to be good; WordPress is just within that range, but every tenth of a second beyond that will be lost later in the LCP.
WordPress: The Most Common System Is Among the Slowest
WordPress runs on 310 of the 736 sites. This is in line with the market: According to W3Techs (as of September 16, 2026, based on an analysis of the most-visited websites), WordPress accounts for 54.1% of .de domains. In Cologne, it ranks alongside TYPO3 as one of the two systems with the poorest performance: 4.5% fast, 82.9% poor, median LCP of 7.7 seconds, 75th percentile of 12.9 seconds—the highest value among all groups with 15 or more measurements.
We’re not looking for the causes at the core—that runs just as well on the 31 fastest sites. They lie in what’s on top of it: themes, page builders, and plugins. In the CMS chapter of the Web Almanac 2025 (data from summer 2025), Elementor is listed on 43% of WordPress sites, and the almanac reports a median file size of 2,894 KB and a Lighthouse score of 41 for WordPress.
Then there’s hosting. A server response time of 0.79 seconds points to shared servers without an object cache; Google states on web.dev (updated November 2025) that shared hosting is generally slower. The version distribution in Cologne is as follows: 132 pages run on WordPress 7.x, 59 on 6.x, 17 on 4.x or 5.x, and 102 do not disclose their version. Anyone still using 4.x or 5.x should update before optimizing load times: Lazy Loading (5.5), WebP (5.8), priority for the featured image (6.3), and AVIF (6.5) were only introduced with these versions, according to the WordPress Core Team.
Field data shows just how much the method influences the results. According to the HTTP Archive’s Core Web Vitals Technology Report , based on CrUX data as of August 2026, 63.2% of WordPress origins achieve good Core Web Vitals among mobile Chrome users in Germany, and 48.7% worldwide. Our 4.5% figure does not contradict this; it measures something different. CrUX tracks real visits over 28 days, using real devices, networks, and caches.
Lighthouse simulates a single cold load on a mid-range device on a throttled network; Google itself states on web.dev that the values therefore differ and that field data takes precedence when both are available. In addition, there is a selection bias: According to the methodology documentation, CrUX only includes origins with sufficient Chrome traffic, excluding iOS users. Small, niche websites are often missing from CrUX, and those are precisely the ones we measured.
The fastest 10% also run on WordPress
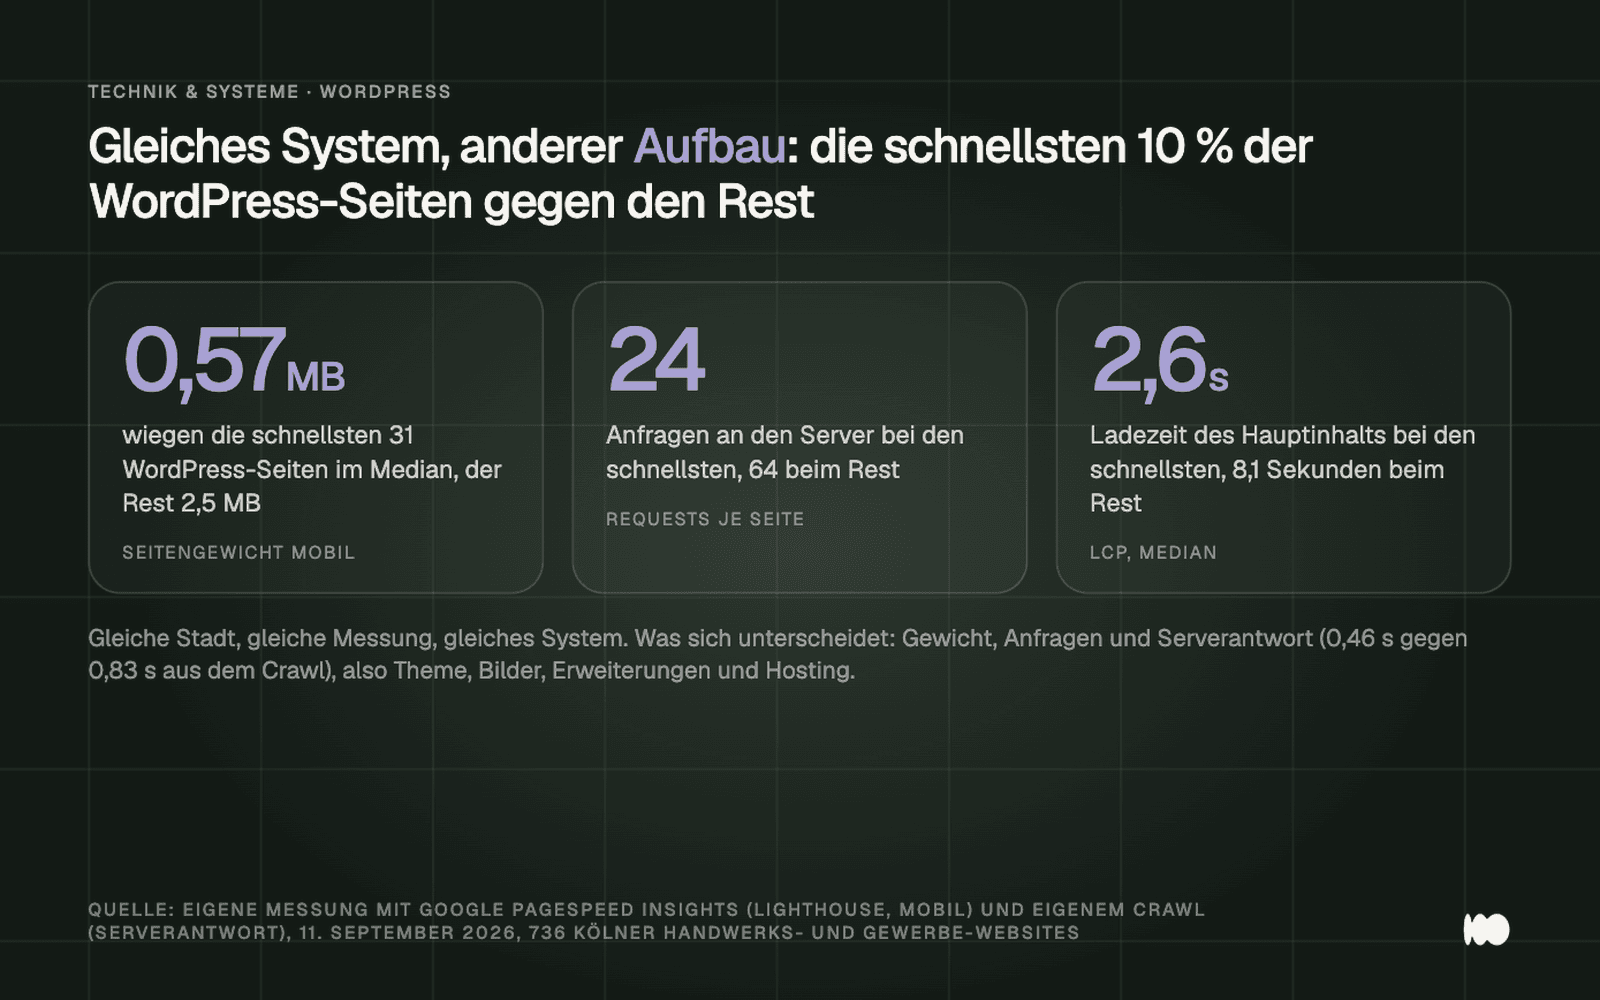
The 31 fastest WordPress sites from Cologne versus the remaining 279: load time, file size, and requests based on lab measurements from September 11, 2026, and server responses from our crawl.
The most important figure from this measurement isn’t found in the ranking, but within the WordPress group. The fastest 10%—that is, 31 of the 310 pages—have a median size of 0.57 MB instead of 2.52 MB and make 24 requests instead of 64. Their server responds in 0.46 seconds instead of 0.83 seconds, and their LCP is 2.6 seconds instead of 8.1 seconds. The system is the same in both groups; what differs are the file size, the number of requests, and the server response time—in other words, the page’s structure.
Changing platforms alone won’t solve anything: If you migrate a 2.5 MB WordPress site—with the same images, the same slider, and the same embeds—to Wix or Webflow, you’ll be carrying that weight over with you. In the source code of the fast 31 sites, we observed—though did not measure—recurring patterns: few plugins, images in WebP or AVIF at display size, no slider in the header, a streamlined theme without a page builder, and hosting with server caching. The most common contrasting feature among the slow sites in the sample is the homepage slider, which loads multiple photos at camera resolution before the first text appears. A single compressed image in this spot often changes the LCP by seconds without requiring any changes to the system.
Wix, Jimdo, IONOS: What These Website Builders Offer
Wix is a surprise. In our crawl, the servers responded in 0.08 seconds—faster than any other system. Nevertheless, only 3.1% of the 32 Wix pages are fast, 75.0% are slow, and the median LCP is 6.8 seconds. The other columns provide some insight: 182 requests and a median of 2.42 MB.
On its blog (undated, according to the manufacturer), Wix describes automatic caching, WebP conversion, and a global CDN. With 182 requests, even a fast server in a lab isn't much help.
IONOS MyWebsite (MyWebsite Creator and MyWebsite Now, 26 pages) is the opposite: lean, with 24 requests and 1.24 MB, a server response time of 0.13 seconds—and yet no page loads in under 2.5 seconds. The median LCP is 4.8 seconds, and 69.2% of the pages perform poorly. Having little code alone isn’t enough if the largest element renders late.
We identified Jimdo on 11 Cologne-based websites. None of them loaded in under 2.5 seconds in our lab tests; the median load time was 7.8 seconds. This sample size is too small to draw a conclusion and contrasts with the field data: According to CrUX (as of August 2026), 98.4% of Jimdo origins achieve good Core Web Vitals among mobile users in Germany, compared to 90.3% for Wix. The most likely explanation is the selection bias from the WordPress section: Small Jimdo sites with low traffic are missing from CrUX, but are included in our sample.
TYPO3 and Joomla: The Agency Systems
According to W3Techs (as of September 16, 2026), TYPO3 accounts for 6.7% of .de domains, ranking second behind WordPress. In Cologne, there are 17 pages with the highest median LCP and the highest proportion of poor-performing pages among all groups with 15 or more measurements: none under 2.5 seconds, 88.2% over 4 seconds, median LCP of 8.4 seconds. Yet the pages weigh only 1.72 MB, make 48 requests, and receive a server response after 0.27 seconds. File size and server response time do not explain this result; only a closer look at the individual Lighthouse report reveals where the time is being spent.
Yet TYPO3 can be fast: According to CrUX (field data, as of August 2026), 87.2% of TYPO3 origins achieve good Core Web Vitals for mobile users in Germany. In our experience, the installations in Cologne are often older agency projects: script libraries from before 2020 and galleries that load all photos before the initial render. The CMS itself plays a lesser role here than what was built on top of it years ago.
Joomla shows the opposite picture for 16-page sites: 12.5% fast, 56.2% poor, with a median LCP of 4.2 seconds—the lowest of all groups. The server response time is rather slow at 0.54 seconds; the fact that Joomla still ranks at the top is consistent with its page weight of 0.93 MB and 34 requests—the lowest among all groups with 15 or more measurements.
Framer, Webflow, Next.js: What the New Systems Are Showing in Cologne
Full disclosure: We build our own sites using Framer and Next.js, sometimes with a headless CMS behind them. You should keep this in mind as you read. Since generator tags rarely give these systems away, we ran a second check on all 736 homepages to search for source code patterns such as /_next/static, framerusercontent.com, and webflow.js.
We found 14 Next.js sites (13 of which are currently in the group with no discernible pattern), 10 Webflow sites, 2 Framer sites, 2 Gatsby sites, and one Astro site. Not a single company website in Cologne combines a modern front end with WordPress as a headless CMS. That’s a total of 29 sites, and exactly one of them loads in under 2.5 seconds.
The 14 Next.js pages have a median LCP of 7.4 seconds, 2.78 MB, and 74 requests, even though their servers respond in 0.14 seconds and five of them are hosted on Vercel. Page weights range from 0.7 MB to 15.7 MB; this points to large images and videos, not to the framework itself. For Webflow (10 pages), one is fast, with a median of 5.7 seconds and 3.56 MB; the heaviest page is 108.8 MB. The two Framer pages load in 3.2 seconds at 4.37 MB, which is too small a sample to draw a conclusion.
The field data confirms this pattern. According to CrUX (field data as of August 2026, from the HTTP Archive’s Technology Report ), among mobile users in Germany, 82.6% of Framer origins and 80.7% of Webflow origins achieve good Core Web Vitals, but only 46.3% of Next.js origins and 41.9% of Nuxt origins do so—less than the 63.2% achieved by WordPress. Part of this is due to web applications rather than corporate websites, but the trend is clear: a framework doesn’t make a site fast; it just makes it easy to build quickly.
The advantages of Framer, Webflow, and statically built Next.js are real: pre-rendered pages, delivery via a CDN, no plugin clutter, and server response times of around 0.1 seconds. However, these benefits only hold true as long as images, videos, and embeds are kept to a minimum. A 15-MB homepage is just as slow on Next.js as it is on WordPress.
Pages with no discernible pattern: sparse, but not a homogeneous group
255 pages—more than one-third of the sample—do not reveal a system in their source code. This group has the highest proportion of fast pages at 26.7 percent, with a median LCP of 4.6 seconds. 24 percent meet both measurable Core Web Vitals thresholds in the lab (LCP and CLS; Lighthouse does not measure the INP response time). The median page size for this group is 1.06 MB; it makes 34 requests and receives the server response after 0.10 seconds.
This is not a homogeneous group. The second source code analysis identifies 13 Next.js pages, 9 additional IONOS pages, 7 Shopify stores, 5 Duda sites, and 4 Strato website builders. 210 pages do not follow any known pattern, including the 29 placeholders; the rest are mostly hand-coded HTML or older website builders. Therefore, comparisons should be made with caution.
Still, they all have one thing in common: minimal code, few requests, and a median server response time of 0.10 seconds. And even here, 55.3% of the pages take longer than 4 seconds to load.
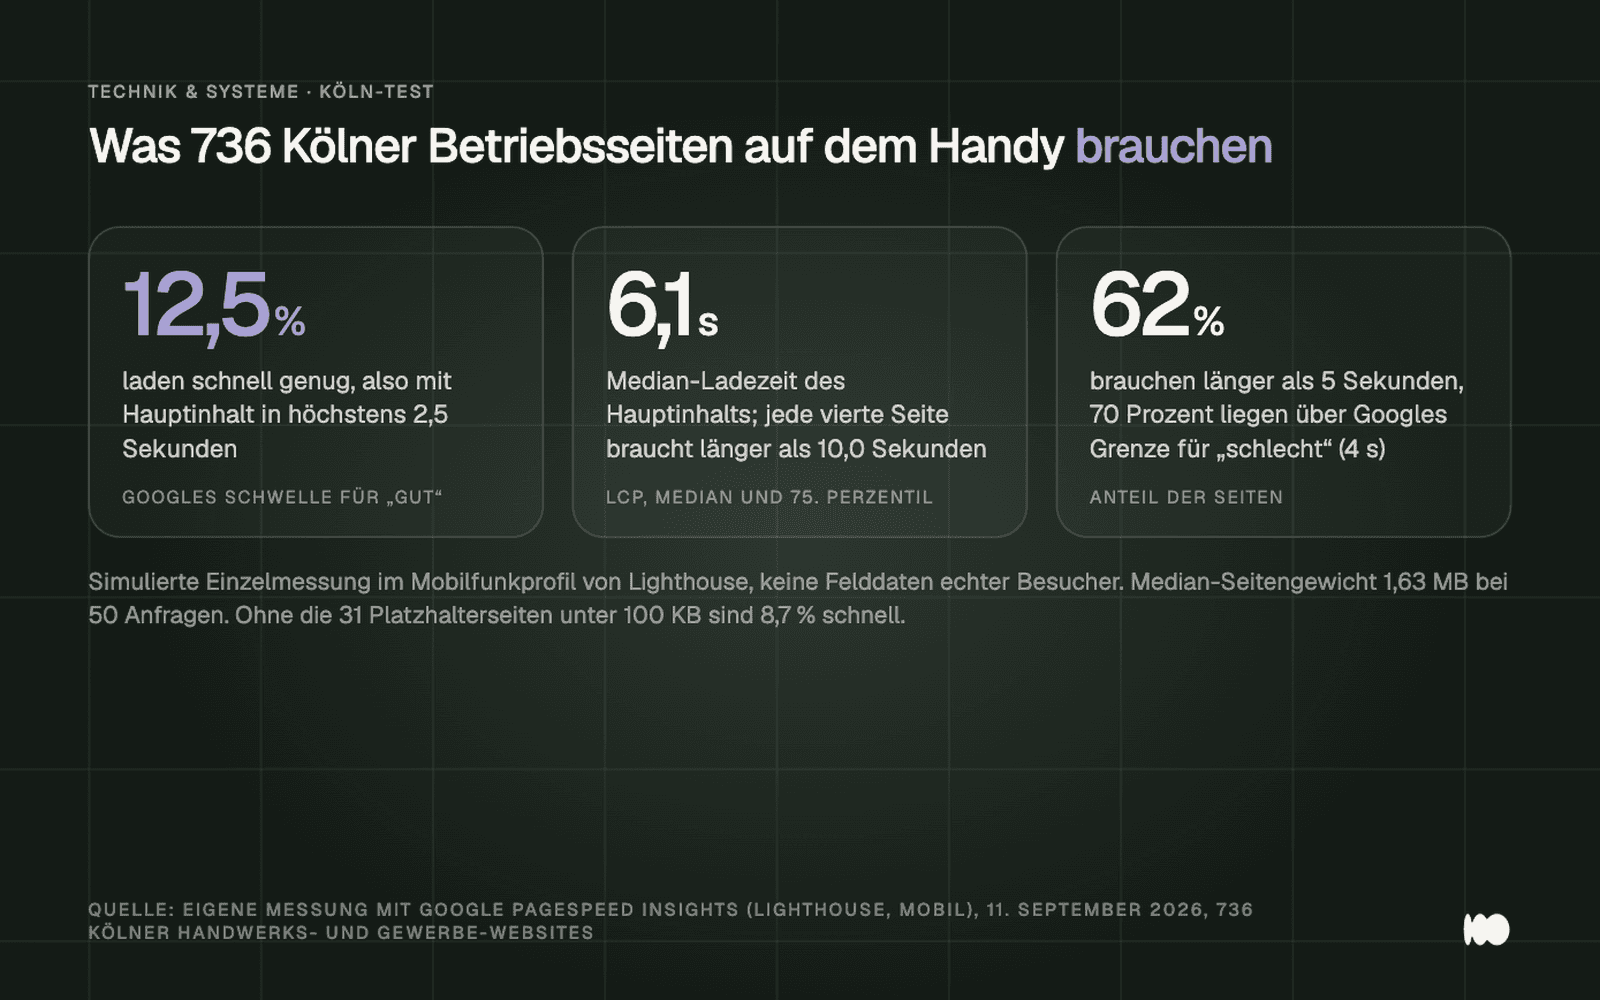
Three key metrics from our lab test conducted on September 11, 2026, across all 736 Cologne-based business websites: percentage of fast pages, median load time, and percentage of pages taking more than 5 seconds to load.
What this means for your choice of system
Rule #1: Choose a system based on team and maintainability, not on promises of speed. The data from Cologne shows that no system is inherently fast—not even Framer or Next.js—and the field data shows that no system is incapable of being fast. The key factor is who will maintain the site in three years.
Rule Two: Speed is built into the foundation, based on four key factors: images, plugins, theme, and hosting. Images should be in the correct format and resized to fit the display area—no sliders; plugins only where they’re needed; a theme without the bloat of a page builder; and a server running the latest PHP and cache. By the way, the update to WordPress 7.0 is not a performance update: The release post (May 2026) contains no mention of load times. It’s not until WordPress 7.1 (August 2026) that images are resized directly in the browser upon upload—according to the developer notes, JPEGs are reduced by about 15%—though this only applies to Chromium-based browsers starting with version 137.
Rule 3: Measure before the relaunch, then measure again afterward. Without a baseline, you can’t tell whether the relaunch improved the load time or just the design. We’ve seen relaunches where the new site was heavier than the old one because the old images were carried over unchanged. To find out whether a relaunch is even worth it, check out the article “Website Relaunch: When It’s Worth It.”
Google lists Core Web Vitals on Search Central (updated December 2025) as part of its ranking systems, but makes it clear that relevant content can still rank highly even if the page experience is poor.
Our Speed Check is an easy way to get started with performance measurement. It measures both mobile and desktop simultaneously using Google PageSpeed Insights—the same methodology as this measurement—and displays not only lab results but also real-world user data where Google has it available. For comparison, here are the Cologne medians: 6.1 seconds for LCP, 1.63 MB, and 50 requests; the server response time of 0.23 seconds comes from our crawl and is only roughly comparable to the PageSpeed score. Under “Largest Contentful Paint,” the report shows the element Lighthouse is waiting for; this lets you know whether an image, a slider, or a font is causing the delay.
Want to know where your site is losing seconds?
An LCP of up to 2.5 seconds is good; if it’s between 2.5 and 4 seconds, it’s worth taking a look at your images and scripts. If it’s over 4 seconds—which is the case for 70.5% of Cologne-based company websites—the load time needs to be addressed in the next redesign, with or without a system change. If you have these metrics and aren’t sure what’s causing the issue, send us the URL via the contact form. We’ll respond within 24 hours—personally and without any sales pitch.
More Articles
© Marschfahrt Studio
Practical knowledge on web design, SEO, AI, and conversion optimization. Based on real projects, without any marketing spin.